Reporting based on qualitative analytics is something that constantly concerns CMOs, and we understand this as well as anyone. Reporting allows you to identify strategic shortcomings, drops in revenue, and much more. Furthermore, the better you understand all performance reports, the more effectively you can report on your successes to senior management.
In this comprehensive 2026 guide, we, as retention marketing specialists, will teach you to analyze performance like no one else. Here, you’ll learn the 3-Layer eCommerce reporting framework. Discover 15 key metrics you absolutely should be tracking. Learn how to create a high-quality dashboard and master best practices for reporting. Get started now!
What is eCommerce Reporting?
eCommerce reporting means gathering, organizing, and presenting data on the performance of your online store. It is presented in a format that helps you understand how your business operates, what factors influence its results, and what needs to be changed.
High-quality reporting is clearly structured and analyzed. It’s not just a simple collection of raw numbers, but answers to specific business questions. Your eCommerce analytics and reporting should answer the following questions:
- Which channels are profitable, not just active?
- Is growth driven by acquiring new customers, or by existing customers returning?
- Do customer retention channels make a noticeable contribution to revenue, or do only expenses come in the appearance of good engagement metrics?
You can use reporting for standard dashboards to appear comprehensive, or you can use it to drive growth by creating systems that answer specific questions. The cost of paid customer acquisition will rise, and margins will shrink. At that point, eCommerce performance reporting will become one of the most effective solutions for marketing executives.
3-Layer eCommerce Reporting Framework for CMOs
From our own experience, we know that the main problem with most eCommerce business performance analytics is the mixing of key metrics. In particular, it often happens that metrics from completely different stages of the customer journey are mixed together. Such a system makes it impossible to analyze and identify the stage at which a decline in performance is occurring.
To solve this problem and prevent it, there is a unique model that divides reporting into three levels corresponding to the stages of the customer lifecycle. We recommend following this model when building eCommerce data analytics and reporting operating under the direct-to-customer (DTC) model. Let’s get into the specifics.
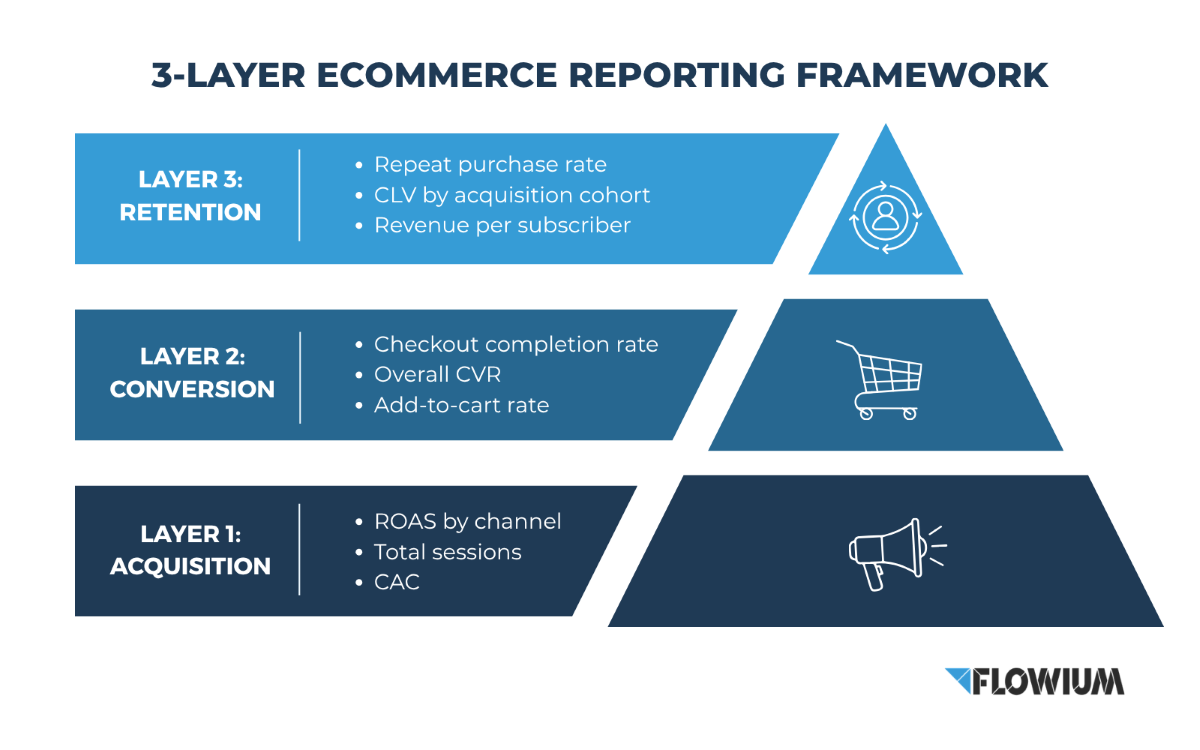
The essence of the three-layer model lies in dividing performance data into three distinct layers, each with its own set of questions and key metrics:
Layer 1: Customer Acquisition
The scale of customer acquisition efforts may vary, but this is the level that typically receives the most attention. However, focusing solely on this stage is a common mistake, as acquisition efforts may show strong metrics quarter after quarter while imperceptibly losing profitability, since no one is tracking what happens after the first purchase.
Key metrics to track at this layer:
- total number of sessions,
- traffic by channel,
- customer acquisition cost (CAC),
- revenue from new customers,
- return on ad spend (ROAS) by channel,
- revenue breakdown between new and repeat customers.
Layer 2: Conversion
This is the stage during which most metrics such as user experience, pages quality, pricing strategy, and the checkout process become measurable on your eCommerce platform.
Key metrics to track at this layer:
- store’s overall conversion rate (CVR),
- add-to-cart rate,
- checkout completion rate,
- cart abandonment rate,
- average order value (AOV),
- conversion metrics at the individual product level.
Layer 3: Customer Retention
Another common mistake in reporting is overlooking or underestimating the customer retention stage, even though it holds the greatest revenue potential for brands operating under a DTC model. As retention experts, we know how costly it can be to constantly acquire new customers and how much more effective it is to retain them. Every returning customer represents revenue that you didn’t have to pay to acquire again.
Key metrics to track at this layer:
- repeat purchase rate,
- CLV by acquisition cohort,
- total revenue from retention channels as a percentage of the store’s total revenue,
- revenue per subscriber across all channels,
- subscriber growth via email, SMS, and push notifications.
15 Key Performance Indicators Essential for an eCommerce Performance Report
eCommerce involves a multitude of metrics, and there’s no need to include every single one in your report, as this would require significant effort, clutter your dashboard, and make the report uninteresting during a presentation.
To avoid cluttering your report with ineffective KPIs, we’ve compiled a list of the most important ones for you.
Here is a list of metrics that a Chief Marketing Officer (CMO) or other marketers need to compile a weekly or monthly report on eCommerce performance. These KPIs focus on the well-being of your business, its growth, and sustainable development:
| Category | KPI | Description |
|---|---|---|
| Acquisition | Total sessions | Including month-over-month and year-over-year growth rate |
| Sessions by channel | Organic, paid, email, SMS, direct, and referral separately | |
| New customer CAC by channel | Avoid blending | |
| ROAS by paid channel | Facebook, Google, TikTok reported independently | |
| New vs. returning customer revenue split | Serves as the clearest indicator of business model sustainability | |
| Conversion | Overall store CVR | Track as a trend, not a single snapshot |
| AOV | Segment by new vs. returning customers to reveal loyalty-driven spend lift | |
| Cart abandonment rate | Industry average is 70.19%; above 75% signals checkout friction | |
| Checkout completion rate | Useful for funnel troubleshooting | |
| Revenue by product category | Reveals which parts of your catalog are carrying the store | |
| Retention | Repeat purchase rate | Serves as the clearest signal of retention program health |
| CLV by acquisition cohort | Break out by channel and period | |
| Combined retention channel revenue as % of total | Email, SMS, push, and owned channels measured together | |
| Revenue per recipient by channel | Serves as the true measure of channel efficiency, beyond open and click rates | |
| Subscriber and list growth rate across channels | Serves as the compounding asset that drives long-term retention revenue |
eCommerce Reporting by Customer Retention Channels: More on Underestimated Data
Reporting on customer retention channels (email, SMS, push notifications, WhatsApp, direct messaging automation) is often overlooked or underestimated and separated from the main performance overview. This usually happens because these channels are hosted on separate platforms and therefore not included in the main dashboard.
By ignoring retention marketing data, you’re missing out on a powerful resource that could significantly impact your decision-making. Customer retention channels form a comprehensive system that maximizes the effectiveness of every marketing dollar you spend. To fully leverage the potential of retention marketing data, track the following metrics in your reporting system:
- Email: Revenue per campaign, revenue per flow, list health, engagement by segment
- SMS: Revenue per send, subscriber growth rate, opt-out rate, cost per SMS-driven purchase
- Push notifications: CTR by push type, revenue from push-triggered flows, subscriber retention rate
- WhatsApp and DM automation: Conversation conversion rate, revenue from conversational flows, engagement by type
- Cross-channel view: Total retention revenue as a percentage of store revenue, assisted conversions, and revenue split between campaign and automated flows
💡 Among these data sources, the cross-channel view is the most strategically important element. It answers the critical question that every eCommerce reporting dashboard needs to address: “Of every dollar retained from existing customers, how much came from which channel, and at what cost?” For brands working with Flowium, this unified overview is usually the first thing we create, because without it, every decision regarding investments in customer retention is based on incomplete information.
How to Create a Dashboard for eCommerce Reporting?
The main purpose of a dashboard isn’t to gather as much information as possible, but to make it truly useful for your team and to support weekly decision-making. We recommend creating a reporting dashboard using the following structure:
- Opening overview: Focus on metrics related to total revenue, store CVR, AOV, and the percentage of revenue by customer retention channels. In the introduction, it’s worth discussing these four key metrics, which provide an overview of the current state of the business.
- Customer Acquisition: Next, we follow the 3-layer reporting structure we discussed earlier, and in this first section, we cover the number of sessions by channel, CAC, ROAS, and revenue from new customers for the reporting period.
- Conversion: The second layer of the report, which discusses CVR, cart abandonment trends, products with the highest conversion rates, and stages of order abandonment.
- Customer Retention: The final section, which includes the total revenue share by retention channel, the repeat purchase rate, revenue by channel, the most effective customer flows, and subscriber status across all channels.
- Trends: This section includes comparisons with the previous month and the previous year, as well as metrics compared to internal benchmarks.
Required dashboard settings:
- The data in the report must be set to update automatically, rather than being manually extracted.
- The dashboard must be accessible in a single shared view for all stakeholders.
- Each section should have a single line of context, if revenue fell, the report should explain why, not just state the fact.
eCommerce Reporting Best Practices from a Retention Marketing Agency
We’ve already covered all the details surrounding eCommerce business reporting, and before we move on, we’d also like to share some useful professional tips with you to help you maximize the effectiveness of your analysis and reporting.
Start With a Question, Not a Metric
Before opening any dashboard, determine what question you’re trying to answer. This focus prevents aimless scrolling through data and mistaking that for analysis.
Set a Review Schedule Based on Reports
Set a regular schedule for making decisions based on reports. Weekly meetings for operational adjustments. Monthly analyses for strategy development. Quarterly conferences for budget redistribution. Depending on the frequency of meetings, you’ll determine the depth of changes and, accordingly, the number of participants.
Standardize Definitions Before You Start Working on the Report
If revenue from email and SMS is double-counted in your overall customer retention metric, the dashboard is unreliable, no matter how good it looks. First, clearly define attribution rules, how returns are handled, and your approach to discounts.
Explain the Numbers and Metrics
Every metric value expresses something; be sure to provide this context in your report. A report without context is just a table. Include at least one sentence or paragraph with explanations and conclusions so that the board can understand everything and you don’t forget what you wanted to highlight. This is precisely what distinguishes a reporting tool from a decision-making one.
Optimize Recurring Metrics as Much as Possible
Automated reporting is essential for ensuring consistency. The downside of manual reports is that they can vary depending on who compiles them, which isn’t an issue with automation.
Audit Your Attribution Model Quarterly
Last-click attribution overestimates the performance of paid campaigns and underestimates customer retention metrics. If your model hasn’t been reviewed in six months, your budget decisions are based on a distorted view of what actually drives revenue growth.
5 Common eCommerce Reporting Mistakes CMOs Make
1. Overreliance on “last-click” attribution. This often overestimates the, often irrelevant, contribution of paid channels, while making email, SMS, and push notifications appear far less effective than they actually are. As a result, brands are constantly increasing their spending on paid advertising while underfunding the channels with the highest ROI. Switch to data-driven attribution or combined multitouch attribution.
2. Failing to account for retention when reporting on acquisition. If your reports show significant revenue growth, but that growth came from new customers you were unable to retain, this is not successful. This situation is a red flag regarding your CLV dynamics. Always combine acquisition data with retention data within the same line in the dashboard.
3. Evaluating retention channels independently. If you have more than one retention channel, your customers will bounce between them, and this is also important data. Tracking email separately from SMS, and push notifications separately from revenue, means completely overlooking the effect of cumulative growth. A comprehensive multichannel program will show significantly better results, but only if you measure it this way.
4. Creating dashboards to impress rather than to inform decision-making. This is the main mistake that renders our article unnecessary. The data collected is the driving force behind eCommerce strategy development, and a dashboard gathers this data to enable breakthrough decisions during meetings. A good dashboard for executives that doesn’t focus on shortcomings is a presentation, not a reporting tool. Design each page with a specific decision in mind.
5. Ignoring cohort-level data. Aggregated metrics hide the most important patterns. Break down CLV, the repeat purchase rate, and AOV by acquisition cohort and channel to see which sources actually bring in the most valuable customers, and which ones fill the funnel with buyers who never return.
Final Thoughts
The key takeaway from our research on eCommerce reporting is that your regular reporting on metrics should actually influence marketing decisions, rather than merely serve as a presentation. When creating your reports, use a convenient three-layer structure, breaking down acquisition, conversion, and retention into individual levels. At each level, track at least the 5 key metrics we mentioned in the article.
As a retention specialist, Flowium agency frequently collects data and creates dashboards for DTC eCommerce clients. That’s why we can be an excellent advisor to you regarding the state of your reporting. Contact us for a free audit to take your reporting to the next level.