Every professional marketer knows that data is essential for successful ecommerce marketing, but turning thousands of metrics into actionable insights is often incredibly challenging. As your technical infrastructure grows, it yields more and more metrics that are impossible to analyse and use without proper organization and unified, real-time visibility.
An ecommerce marketing dashboard brings all your key KPIs into one centralized view, helping you monitor performance, identify trends, and optimize campaigns without digging through multiple platforms. The result is better decision-making, improved team alignment, and higher marketing ROI.
In this guide, we’ll outline what an ecommerce marketing dashboard is, why it matters for brands, the essential metrics to track, and best practices for building a dashboard that drives growth.
What is an Ecommerce Marketing Dashboard?
An ecommerce marketing dashboard is a centralized reporting tool that brings together your most important marketing, sales, and customer data in one place. It is an interface that automatically gathers performance data from online sales channels and presents it in easily readable formats, such as tables, graphs, and charts.
The primary data sources are marketing platforms, customer databases, sales systems, and inventory management solutions. After the dashboard consolidates all the data from these sources, it practically becomes your online business’s command center.
So, instead of switching between multiple platforms such as Google Analytics, Meta Ads, Shopify, Klaviyo, or your CRM, your marketing team can monitor performance indicators from a single interface that’s easy to read and manage.
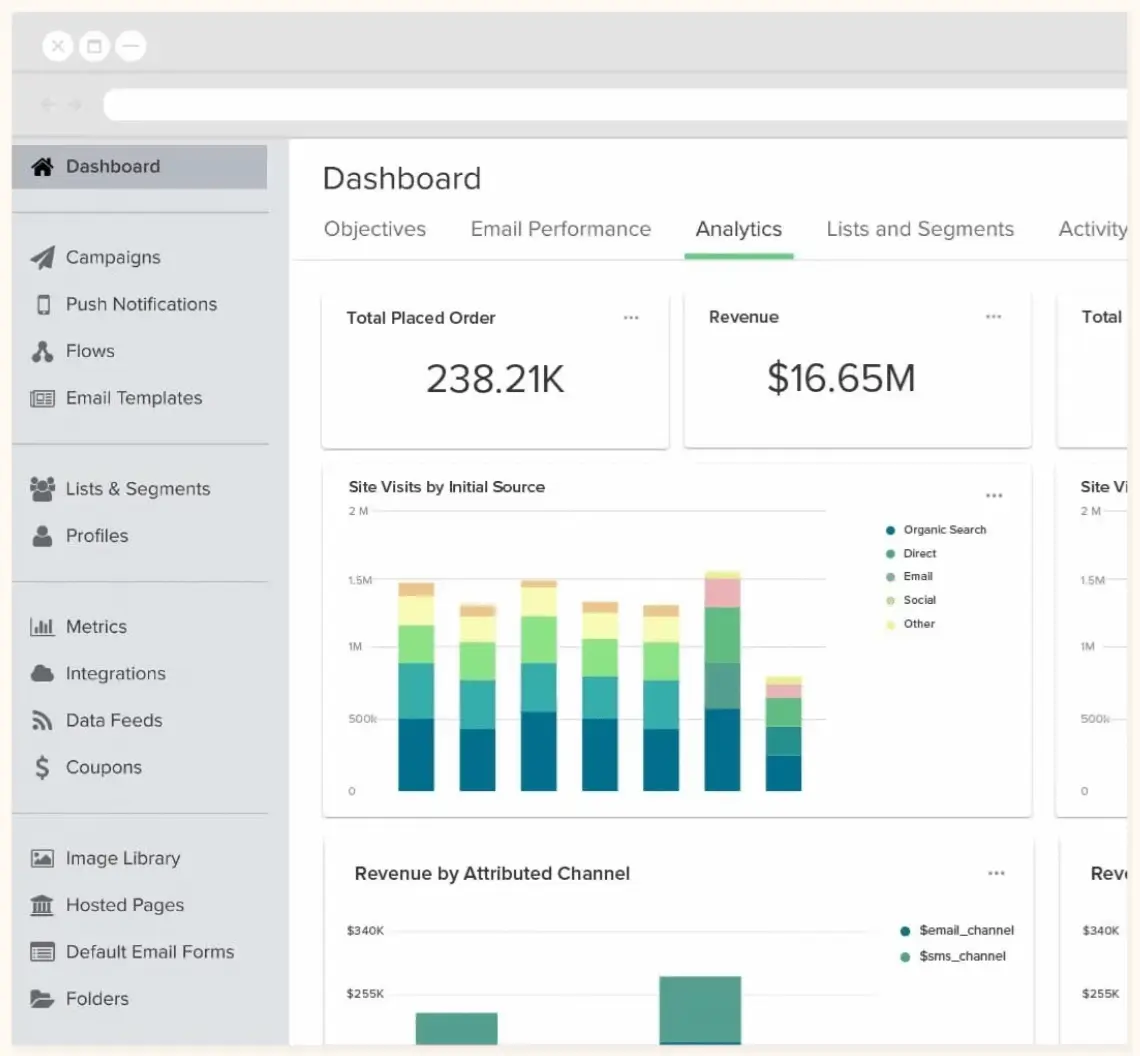
The ideal dashboard design may save hours of development work and provide strong features straight out of the box, regardless of how big your online store is.
Business owners, analysts, and sales and marketing teams can quickly monitor conversions, revenue, and other operational metrics with the use of dashboards. Dashboards enable users to track progress, spot opportunities and bottlenecks, and make educated decisions by centralizing data from all areas of the company.
What is Ecommerce Dashboard Template?
To help users start tracking their progress through dashboards, many platforms offer native dashboard templates or enable integrations with third-party services that create custom templates.
An ecommerce dashboard template is a pre-built dashboard layout that includes the most important charts, reports, and key performance indicators needed to monitor an online store’s performance.
The main purpose of ecommerce dashboard templates is to facilitate the layout building process for businesses that are still unsure about what they should track. Most of their templates, depending on the type or category, already have a “starter pack” of essential metrics.
So, instead of building a dashboard from scratch, businesses can use a template to quickly visualize data from platforms such as Shopify, WooCommerce, Google Analytics, Meta Ads, Google Ads, email marketing tools, and CRM systems.
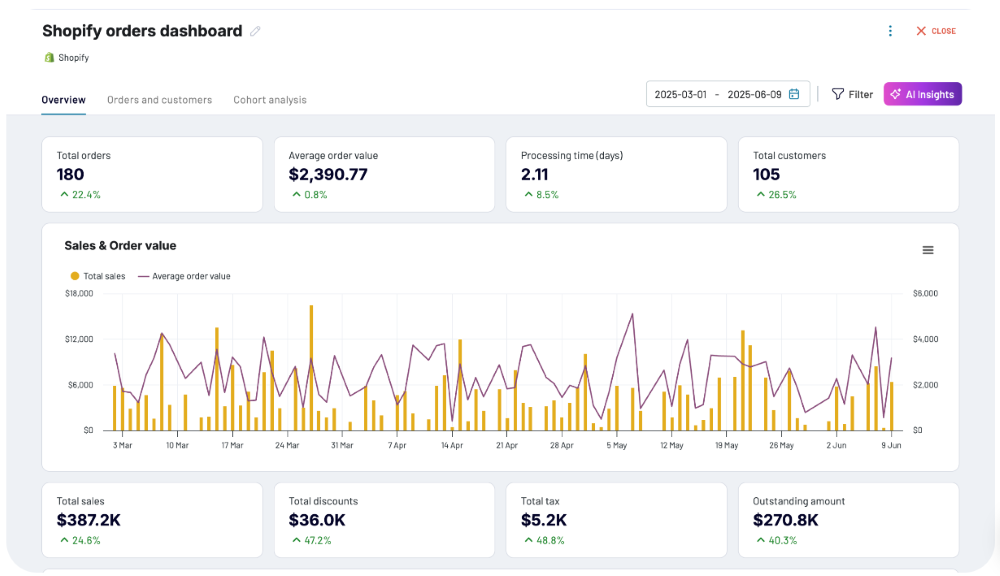
Most ecommerce dashboard templates organize metrics into categories such as sales, marketing, customer analytics, and operations. This provides a centralized view of business performance, making it easier to monitor trends, measure campaign effectiveness, and identify growth opportunities.
Why Ecommerce Marketing Dashboards Matter
Modern ecommerce brands generate data from dozens of marketing channels every day. Without a centralized dashboard, valuable insights can get lost in spreadsheets and disconnected reports. As a result, you have no idea which parts of your strategy are driving growth and which ones need optimization.
In this case, ecommerce dashboards are vital instruments for monitoring and controlling sales, marketing, and operations performance. They offer precise, timely insights that help with both short-term and long-term planning. They also facilitate better team coordination and collaboration.
An ecommerce marketing dashboard helps businesses:
- Monitor marketing performance in real time.
- Track key KPIs across multiple channels from one location.
- Identify trends, opportunities, and performance issues faster.
- Improve collaboration between marketing, sales, and operations teams.
- Make data-driven decisions that increase revenue and marketing ROI.
Key Point: Dashboards not only make data easier to access, but they also enable the identification of trends, opportunities, and problem areas. With this tool, teams can react quickly to changes in performance and keep a close eye on KPIs that determine ecommerce profitability.
How Ecommerce Dashboards Improve Decision-Making
By visualizing real-time data, ecommerce dashboards help teams understand campaign performance, customer behavior, revenue trends, and marketing ROI at a glance. This enables faster decision-making, better budget allocation, and more effective campaign optimization.
Through a dashboard, marketing professionals can quickly obtain reliable, current statistics instead of spending hours gathering data from several platforms. Teams can see changes in campaign performance, client acquisition costs, conversion rates, and sales trends before they become more serious problems thanks to interactive charts and visualizations that make complex data easier to grasp. Marketers can now concentrate on strategy, optimization, and business expansion rather than data preparation, thanks to the transition from manual reporting to automated analytics.
Key Benefits of Using an Ecommerce Marketing Dashboard
By offering clarity and flexibility in every aspect of an ecommerce company, dashboards can help you deal with changes in consumer demand, growing ad spending, supply chain delays, and other challenges.
The biggest advantages of implementing an ecommerce marketing dashboard include:
- Centralized reporting across all marketing channels.
- Real-time visibility into campaign performance.
- Faster reporting with automated data updates.
- Improved marketing budget allocation.
- Better forecasting using historical performance data.
- Greater alignment between marketing, sales, customer support, and operations.
- More informed decisions based on accurate, actionable insights.
Let’s look more closely at the most substantial benefits of using ecommerce analytics dashboard.
1. Data-Driven Decision-Making
Making smart decisions based on actual facts rather than conjecture is one of an ecommerce dashboard’s greatest benefits. Dashboards facilitate the identification of trends, anomalies, and real-time performance evaluation by merging metrics from various platforms into a single view. While automatic alerts tell teams when campaigns or products start to underperform, allowing for prompt corrective action, shared KPIs guarantee that every department assesses success using the same measures.
2. Better Marketing Performance Insights
Marketing dashboards provide complete visibility into campaign performance across every acquisition channel.
Teams can continuously monitor key ecommerce KPIs such as:
- Conversion rate
- Customer acquisition cost (CAC)
- Average order value (AOV)
- Return on ad spend (ROAS) Marketing ROI
- Customer lifetime value
Real-time performance tracking assists marketers in identifying effective campaigns, optimizing budgets, refining messaging, and increasing conversion rates before poor performance affects revenue.
3. Centralized Data and Analytics
One of the biggest benefits of an ecommerce analytics dashboard that makes it so convenient for marketers is the unified view. You don’t need to switch between advertising platforms, ecommerce software, CRM systems, analytics tools, and spreadsheets, since dashboards automatically collect and display data in one centralized location. This feature reduces manual reporting, minimizes human error, and allows teams to compare performance across marketing, sales, operations, customer support, and fulfillment without wasting time consolidating reports.
4. Improved Team Collaboration
Every department can access a single source of truth thanks to ecommerce analytics dashboards. Your marketing, sales, operations, finance, and executive departments will use the same real-time data, which minimizes communication gaps and gets rid of contradicting reports. Faster decision-making, increased accountability, and more robust cooperation toward common corporate objectives result from better departmental alignment.
5. Enhanced Inventory and Sales Management
Although marketing dashboards primarily focus on campaign performance, you can also integrate inventory and sales data to get a more complete picture of your ecommerce operations.
With this tool, businesses can:
- Monitor top-selling and underperforming products.
- Forecast inventory demand more accurately.
- Detect low-stock items before they impact sales.
- Reduce costly stockouts and excess inventory.
- Coordinate promotions with available inventory.
This connection between marketing and inventory helps maximize sales opportunities while improving operational efficiency.
6. Significant Time Savings Through Automation
Manual reporting frequently necessitates data exporting, spreadsheet updates, and cross-platform KPI calculations. By gathering and updating data in real time, ecommerce dashboards simplify these procedures. Teams consequently spend more time analyzing information, optimizing marketing, and carrying out growth initiatives rather than producing reports.
7. Improved Customer Experience
Dashboards also assist organizations in better understanding client behavior by monitoring browsing trends, purchase history, engagement metrics, return rates, customer happiness scores, and loyalty indicators. With the use of these analytics, marketers can better segment audiences, tailor ads, enhance retention tactics, and promptly spot problems that can have a detrimental impact on the customer experience. Increased lifetime value, greater customer pleasure, and deeper loyalty are frequently the results of a more customized buying experience.
Key Metrics to Track on Ecommerce Analytics Dashboard
When dashboards showcase a specific collection of indicators that represent performance in sales, marketing, operations, and customer experience, they are most effective. The following are important ecommerce metrics to monitor in these four domains:
Sales Metrics
Sales metrics measure the financial health of your ecommerce business and reveal how effectively your store converts demand into revenue.
| ΚΡΙ | Why You Need It On Ecommerce Analytics Dashboard |
|---|---|
| Total Revenue | Measures the total income generated from all sales over a specific period. |
| Transaction Volume | Tracks the total number of orders placed, helping identify sales trends and purchasing activity. |
| Average Order Value (AOV) | Calculates the average amount customers spend per order, making it useful for evaluating upselling and cross-selling strategies. |
| Revenue by Channel | Shows which marketing channels generate the highest sales and revenue. |
| Sales Growth Rate | Measures revenue growth over time to evaluate overall business performance. |
Marketing Metrics
Marketing KPIs help evaluate campaign effectiveness, customer acquisition, and return on investment across all marketing channels.
| ΚΡΙ | Why You Need It On Ecommerce Dashboard |
|---|---|
| Conversion Rate | Measures the percentage of visitors who complete a desired action, such as making a purchase. |
| Bounce Rate | Indicates how many visitors leave your website without interacting, helping identify landing page or user experience issues. |
| Return on Ad Spend (ROAS) | Calculates the revenue generated for every dollar spent on advertising campaigns. |
| Customer Acquisition Cost (CAC) | Measures how much it costs to acquire a new customer across all marketing efforts. |
| Marketing ROI | Evaluates the profitability of your overall marketing investment. |
Customer Metrics
Customer analytics reveal how effectively your business attracts, retains, and grows its customer base.
| ΚΡΙ | Why You Need It On Ecommerce Dashboard |
|---|---|
| Customer Lifetime Value (LTV) | Estimates the total revenue a customer is expected to generate throughout their relationship with your business. |
| Repeat Purchase Rate | Measures how often existing customers return to make additional purchases. |
| Cart Abandonment Rate | Tracks the percentage of shoppers who add products to their cart but leave before completing checkout. |
| Net Promoter Score (NPS) | Measures customer satisfaction and loyalty by indicating how likely customers are to recommend your brand. |
| Customer Retention Rate | Evaluates how successfully your business keeps customers over time. |
Operational Metrics
Operational KPIs help ensure your marketing efforts align with inventory availability and fulfillment performance.
| ΚΡΙ | Why You Need It On Ecommerce Dashboard |
|---|---|
| Inventory Levels | Shows current stock availability to prevent overselling or stock shortages. |
| Inventory Turnover Rate | Measures how quickly inventory is sold and replenished, helping optimize stock management. |
| Order Fulfillment Time | Tracks how quickly orders are processed and shipped after purchase. |
| Delivery Time | Measures shipping speed and reliability, which directly impacts customer satisfaction. |
| Return Rate | Monitors how frequently products are returned, helping identify quality or fulfillment issues. |
Pro Tip How To Choose KPIs:
Not every ecommerce business needs to track the same metrics. The most effective dashboards prioritize KPIs that align with current business goals. For example, brands focused on growth may prioritize CAC, ROAS, conversion rate, and revenue, while businesses emphasizing customer loyalty may prioritize CLV, repeat purchase rate, retention rate, and NPS. By monitoring the right combination of sales, marketing, customer, and operational metrics in one centralized dashboard, ecommerce teams gain a complete view of business performance and can make faster, data-driven decisions that support sustainable growth.
Best Practices for Creating an Ecommerce Dashboard
Dashboards must do more than just show statistics because e-commerce is a fast-paced sector characterized by dynamic sales channels, intricate supplier chains, and rapidly changing client expectations. The most successful ones are purposefully designed: they present relevant metrics, provide timely warnings, are easy to use, and can adapt as business requirements evolve.
As ecommerce companies continue to refine their sales, marketing, and operations strategies, the following best practices can assist them in creating precise, useful dashboards that enable them to adjust to new trends:
Define Clear Goals and KPIs
Start by identifying the business objectives your dashboard should support. Whether your goal is increasing revenue, improving ROAS, lowering customer acquisition costs, or boosting customer retention, every KPI should align with a measurable outcome. Avoid tracking metrics simply because they’re available. Instead, focus on the KPIs that directly influence marketing performance and business growth.
Prioritize Your Most Important Metrics
A dashboard should highlight the metrics that require immediate attention. Prominently display high-impact KPIs such as revenue, conversion rate, customer acquisition cost, AOV, and customer lifetime value, so they’re easy to monitor at a glance. Organize related metrics into logical sections (sales, marketing, customers, and operations) to improve readability and help users quickly find relevant insights.
Keep the Dashboard Simple
One of the most common mistakes is trying to display too much information. Overloaded dashboards make it harder to identify trends and slow down decision-making. Use a clean layout with clear labels, consistent formatting, and sufficient spacing between widgets. Focus on the metrics users need most, and remove unnecessary charts or low-priority data.
Monitor Performance in Real Time
Marketing conditions can change quickly, making real-time reporting essential for ecommerce businesses. Connect your dashboard to live data sources such as your ecommerce platform, advertising accounts, CRM, email marketing software, and web analytics tools to ensure your reports remain accurate and up to date. Consider setting up automated alerts for significant changes in key metrics, such as sudden drops in conversion rate, rising customer acquisition costs, declining ROAS, or inventory shortages. Real-time notifications enable teams to respond before small issues become costly problems.
Use Clear Data Visualizations
Good data visualization makes complex information easy to interpret. Choose chart types that match the data you’re presenting-for example, line charts for performance trends over time and bar charts for comparing channels or campaigns. Maintain consistent colors, labels, and formatting throughout the dashboard, and use interactive filters to allow users to explore performance by channel, campaign, product, or date range.
Continuously Review and Optimize
Your dashboard should evolve alongside your business. As marketing strategies, sales channels, and business objectives change, regularly review your dashboard to ensure it continues to display the most relevant metrics. Gather feedback from marketing, sales, and leadership teams, remove outdated reports, and add new KPIs as priorities shift. A dashboard that evolves with your business will continue to provide valuable insights and support better decision- making over time.
Conclusion
An effective ecommerce marketing dashboard translates raw data into meaningful insights that fuel growth. You can improve conversion rates, find friction points, and analyze client journeys with the use of these dashboards. You also get real-time data, predictive analytics, and smarter inventory management. By combining the appropriate analytics, visuals, and connectors, you can create a powerful tool for making better business decisions.
Still unsure how to implement this solution into your ecosystem? Contact Flowium to get professional consulting and assistance in top-notch analytics and reporting solutions.
Frequently Asked Questions
What constitutes a good ecommerce dashboard?
An efficient ecommerce dashboard is adaptable to meet the demands of various teams, centralizes real-time data from several sources, and highlights important metrics with clear visuals. It should be easy to interpret at a glance, regularly updated, and focused on insights that drive business growth. Facilitating quick, data-driven decisions and cross-team cooperation is the aim.
Which three KPIs are necessary for an ecommerce dashboard?
An e-commerce dashboard must have these three key performance indicators:
– Total revenue, which analyzes overall sales performance
– The number of website visits that result in sales is known as the conversion rate.
– Customer acquisition cost, which indicates how well marketing expenditures generate new clients
What makes a report different from a dashboard?
A dashboard differs from a report in that it gives a real-time visual summary of the most essential metrics on a single screen, whereas a report is often text-based and more extensive. Dashboards let users keep an eye on performance, discover problems quickly, and recognize important patterns. Reports contain historical data and analysis, frequently alongside recommendations and a deeper, more contextual narrative.