Your total retention rate is an average, and averages can be deceiving. They hide what you actually need to know: which groups are genuinely sticking around and what they did differently, by blending your best and worst users into a single number.
Cohort analysis fixes that. By grouping users who share a starting point or behavior and tracking them over time, you can see exactly where people find value and where they drop off. In a market where retention now matters more than acquisition, this is the foundation for lowering churn.
This guide covers what cohort analysis is, how to read a cohort chart, and how teams use cohorts for more than just retention.
What Is Customer Cohort Analysis?
Let’s start our dive into the topic with a simple definition.
Cohort analysis is the practice of grouping customers by a shared trait or behavior and tracking that group’s activity over time, rather than looking at your customer base as one big pool.
A cohort is any group of users who share a starting point or behavior: an acquisition date, a plan type, a first-purchase category, or an action like signing up for SMS marketing. Say a store builds a cohort of customers who opted into SMS alerts. By tracking that group’s purchase frequency and order value against non-SMS customers, the brand can see whether SMS is actually driving incremental revenue and decide whether it’s worth expanding the program.
Cohorts work like saved filters: instead of rebuilding a query every time you check performance, you name a group (“Q4 holiday shoppers,” “First-purchase discount users,” “Power users”) and revisit it over time. This matters because averages flatten everything. A storewide retention number hides the fact that your best-performing cohort might be retaining at 3x the rate of your worst, and that gap is where your next growth lever lives.
Cohort Analysis vs Customer Segmentation
Although “segment” and “cohort” are sometimes used synonymously, they are not the same. While a cohort combines events and time to ensure you’re tracking the same group of people, segmenting typically provides you with a snapshot of a single activity.
Put simply:
- Segmentation shows you who’s in the group right now based on shared characteristics.
- Cohort analysis adds a time dimension since it tracks how a specific group behaves throughout the customer lifecycle.
A cohort is really a segment with time attached. An ecommerce brand might segment customers by “purchased from the sale category.” Still, only cohort analysis reveals whether those customers made a second purchase in the following 90 days, or churned after the discount wore off.
| Segmentation | Cohort Analysis | |
|---|---|---|
| Shows | Who shares a specific trait | How this group behaves over time |
| View | Point-in-time snapshot | Dynamic with a tracked timeline |
| Example | Group of customers who bought a specific product | Group of customers who bought a specific product in June—are they still buying this product in August? |
Cohort Segmentation and Types of Cohorts
By putting your users or customers into cohorts according to shared traits or behaviors, cohort analysis enables you to gain important insights about user retention and customer behavior. You can examine user engagement and retention rates using a variety of cohorts, each of which provides a distinct viewpoint on how certain groups engage with your company. The typical classifications are:
- Acquisition Cohorts
These cohorts are determined by the date on which users engage with your product or service for the first time, such as when they register or make their first purchase. You may observe how various marketing channels or campaigns affect user behavior and retention over time by examining acquisition cohorts. This enables you to determine which acquisition tactics are most successful in attracting devoted clients.
- Behavioral Cohorts
In this case, users are grouped according to particular behaviors they take, such as finishing a tutorial, buying something, or using a feature. By identifying which user actions are associated with greater engagement and long-term value, behavioral cohorts assist you in analyzing how specific behaviors affect retention and revenue.
- Time-based Cohorts
These cohorts are arranged according to when users complete a particular task, such as a limited-time offer or a holiday sale. When assessing how seasonal patterns or outside events impact user behavior and retention rates, time-based cohorts are particularly helpful.
- Segment-based Cohorts
These cohorts allow you to categorize users based on firmographic or demographic information, such as geography, industry, or company size. With this strategy, you can customize user experiences and marketing campaigns for various demographics, increasing engagement and conversion rates.
- Size-based Cohorts
The scale of user engagement, such as the number of purchases made or the frequency of logins, defines these cohorts. By identifying behavioral similarities among users with comparable activity levels, size-based cohorts can help you develop tactics for re-engaging less active consumers or nurturing high-value ones.
You can better understand how different user segments react to your marketing efforts, how retention varies among groups, and where to concentrate your resources for optimum impact by utilizing these distinct cohort types in your cohort analysis. This method gives you the ability to improve user engagement, hone your tactics, and promote long-term growth.
Why Is Cohort Analysis Important for Ecommerce?
When marketers invest in long-term cohort analysis, they’re choosing evidence-based marketing over guesswork.
Cohort analysis is grounded in actual customer behavior linked to actual outcomes-not assumptions. According to Harvard Business Review, acquiring a new customer costs 5 to 25 times more than retaining an existing one, and even a modest improvement in retention rate can meaningfully increase profitability.
For ecommerce brands facing rising ad costs, that math makes retention—not just acquisition-the higher-leverage place to focus. When brands study these interactions at scale and adjust their marketing accordingly, they can expect:
- Increased Campaign Engagement. Consumer behavior is the clearest signal of what customers want and when they want it. Because cohort analysis reflects real customer actions at every stage of the lifecycle, brands can build stage-specific campaigns-like a post-purchase flow for first-time buyers versus a win-back offer for lapsed ones-that drive meaningfully higher engagement than generic, one-size-fits-all campaigns.
- Increased Marketing ROI. Cohort analysis strips out a lot of the guesswork in marketing spend, which drives efficiency. Take a brand with high customer acquisition costs (CAC): by running a cohort analysis on customers acquired during the holiday season, that brand can see their actual long-term value-not just their first-order value-and use that to decide how much to spend acquiring similar customers next year. If holiday-acquired customers turn out to have strong repeat-purchase behavior, the brand can justify a higher CAC for that cohort with confidence.
- Higher Customer Retention Rates. Cohort analysis doesn’t just explain retention-it helps you build it. A brand considering a loyalty program might analyze its highest-spending cohort and discover they consistently purchase near the end of the month, right after payday. That insight could shape when the brand times loyalty rewards, replenishment reminders, or exclusive early access-turning a passive observation into an active retention lever.
Use Cases of Cohort Analysis in Marketing
Churn and Retention
This is cohort analysis’s original use case. Identify the action or inaction most closely linked to churn, build a cohort around it, and track how that group’s share shrinks over time. For an ecommerce brand, that might mean isolating customers who never used a discount code on their first order, or who abandoned checkout at the shipping-cost step. Once you’ve identified that “likely to churn” cohort, you can adjust onboarding emails, promotional messaging, or the checkout flow itself to shift that behavior before it turns into a lost customer.
Feature and Product Adoption
As more ecommerce growth comes from the shopping experience itself—not just ads-cohort analysis increasingly shows up in product and feature adoption. Split customers into those who did and didn’t use a feature (say, saved payment methods, a size guide, or subscribe-and-save) and compare their retention and repeat-purchase rates. If the adopter cohort retains significantly better, you’ve found an activation milestone worth pushing new customers toward during onboarding, for instance, prompting first-time buyers to save their payment info at checkout rather than leaving it to chance.
Acquisition and Ad Attribution
Grouping cohorts by acquisition source lets you judge a channel by the quality of customers it brings in, not just the volume or cost per signup.
This is where cohort analysis earns its keep: a paid channel that delivers cheap first-time buyers who never return is actually more expensive, long-term, than a pricier channel whose customers keep buying for months. You’ll only see that gap in a cohort view; a last-touch attribution model just shows you the first sale, not what happened after. You can answer questions that a last-touch model cannot, such as whether users from a certain campaign returned to make a second purchase, join a loyalty program, or subscribe, by using event-based tracking, which links marketing touchpoints to in-product action.
How to Conduct Customer Cohort Analysis
Cohort analysis is an effective method for tracking user retention, analyzing consumer behavior, and finding useful insights that might revolutionize your company. Here’s a step-by-step tutorial to get you going:
Step 1. Define Your Objective
Determine your goals for your cohort analysis first. Are you trying to boost repeat purchase rate, understand why certain customers churn after one order, or increase average order value over time? A specific objective—not just “our customers better”—will shape every decision that follows, from which cohort type you choose to which metrics you track.
Step 2. Select the Cohort Type
Decide which cohort type from the ones we mentioned best fits your objectives. Use behavioral cohorts to determine how particular behaviors affect retention, or acquisition cohorts to assess the efficacy of various marketing channels.
Step 3. Gather Information
Collect the relevant consumer data you require, including transaction history, user behavior, demographics, and engagement metrics. Your platform likely already tracks most of this (Shopify, Klaviyo, and GA4 are common sources for ecommerce brands). The depth and accuracy of this data will directly determine how reliable your conclusions are.
Step 4. Create a Cohort Table
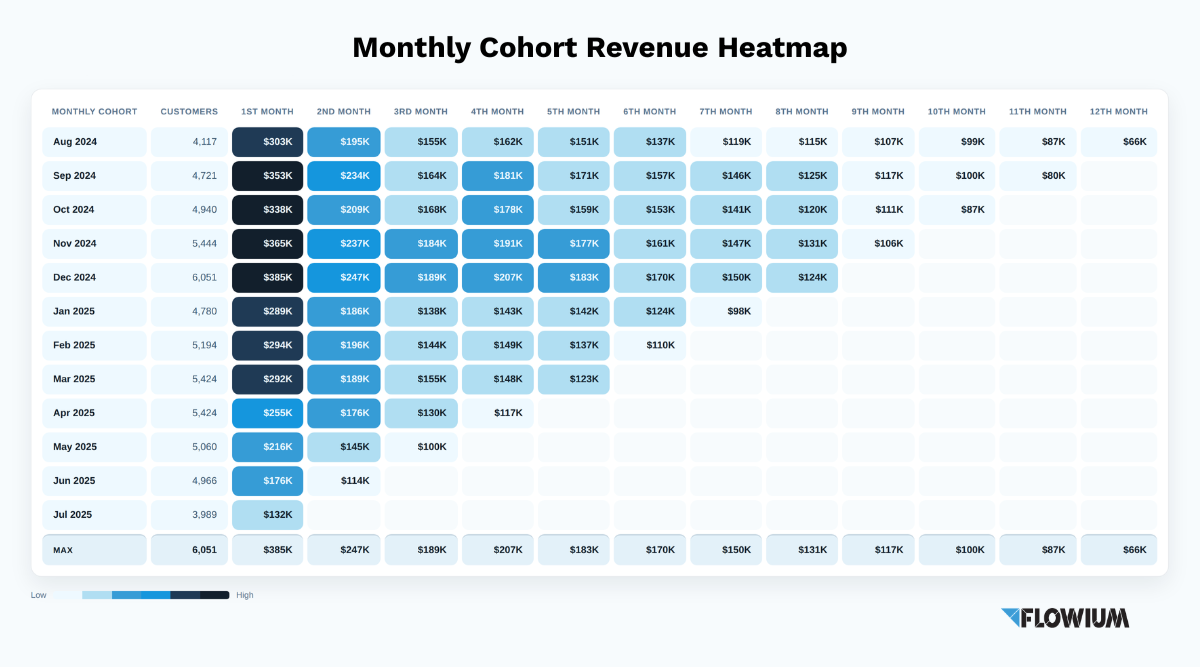
Organize your data into a cohort table: each row represents a cohort (say, customers who made their first purchase in August), and each column represents a time period or metric (month 1 retention, month 2 retention, repeat purchase rate, revenue per cohort). This is the core structure that makes cohort analysis useful-it’s what turns raw transaction data into a comparable timeline.
Step 5. Analyze the Data
Look for trends and patterns in your cohort table. Examine how different cohorts perform over time and look for relationships between user behavior and retention.
Step 6. Visualize the Data
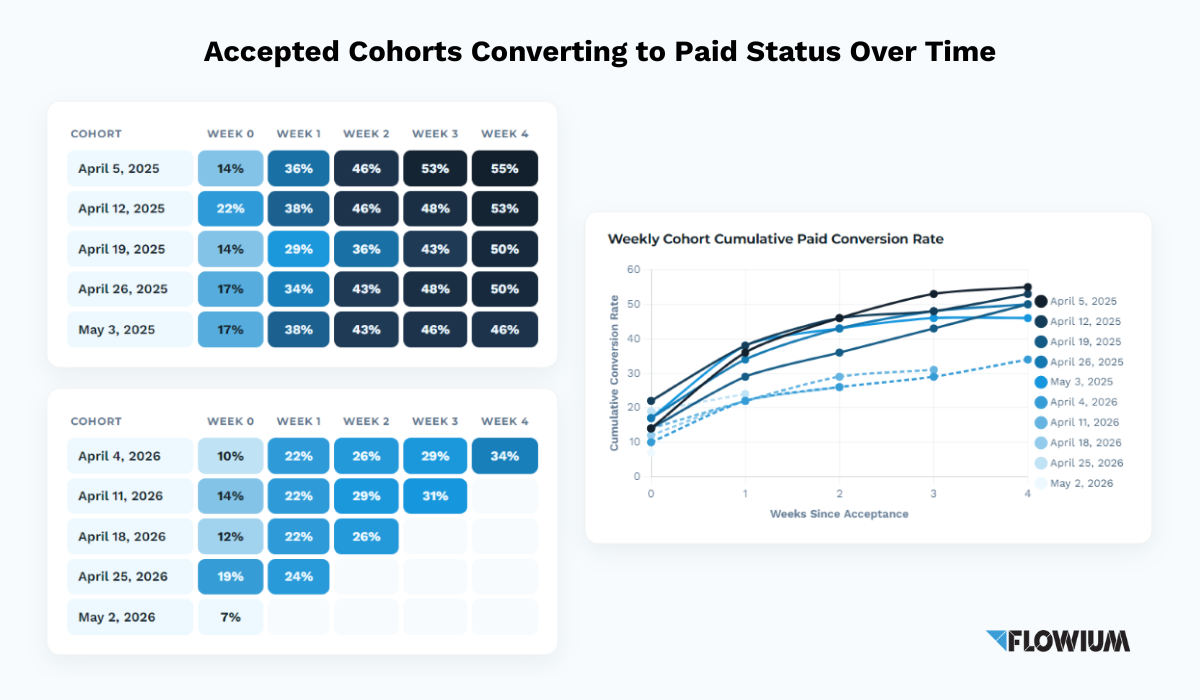
Turn your table into charts-retention curves, heat maps, or cohort grids. Visuals make it far easier to spot which cohorts are outperforming or underperforming at a glance, and they’re much easier to share with stakeholders than a raw spreadsheet.
Step 7. Interpret the Results
Make inferences based on your analysis. Determine which marketing campaigns work best, which cohorts have the highest retention rates, and where consumers fall off the customer lifecycle.
Step 8. Improve Your Strategy
Utilize your cohort analysis’s practical findings to improve user experience, boost sales, and optimize your marketing campaigns. Based on what you’ve discovered, modify your marketing, product offerings, or engagement tactics.
How to Interpret Cohort Analysis
A cohort analysis chart enables you to compare the metrics and behavior of several cohorts over time because they share this characteristic. This allows you to identify the cohorts with the best or worst performance and determine the reasons influencing that performance.
How to Read a Cohort Chart
Most cohort charts follow the same basic layout similar to the one you can see in the Klaviyo example below.
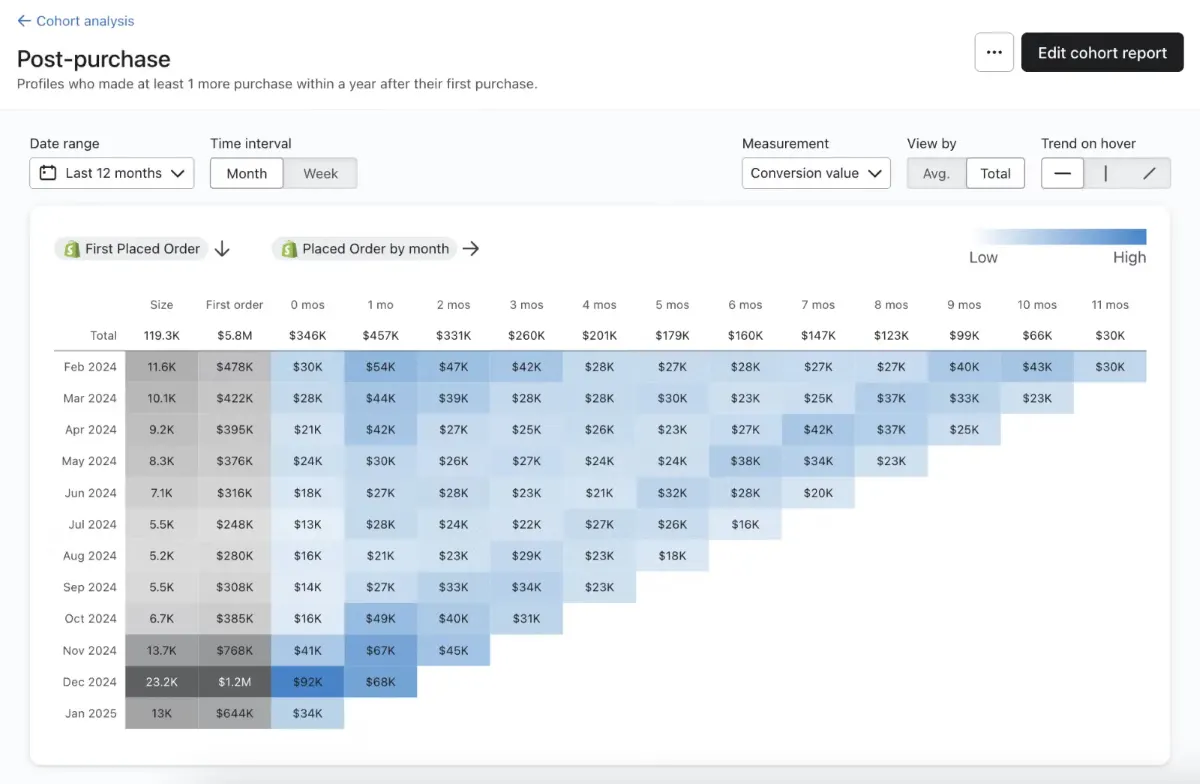
Each row is a cohort (customers who made their first purchase in a given month, for example), and each column is a time period after that starting point (Week 1, Week 2, Month 3, and so on). The cells show a metric—retention rate, repeat purchase rate, or revenue for that cohort then, often shaded so darker or lighter colors make strong and weak performance easy to spot at a glance.
- Reading across a row shows you how a metric evolves for a single cohort over its lifecycle: when do customers tend to drop off, and does that timing line up with anything (a subscription renewal, the end of a return window, a follow-up email that never went out)?
- Reading down a column shows you how different cohorts compare at the same stage. If your March cohort retains at 35% by month two but your April cohort only hits 20%, something changed-a pricing shift, a different acquisition channel, a change in your onboarding emails— and that’s worth investigating.
What to Look for in a Cohort
- The diagonal drop-off. Nearly every cohort chart shows retention declining as you move across a row-this is normal. What matters is the shape of that decline. A steep early drop followed by a flat line (customers who stick past week one tend to stay) points to a different fix than a slow, steady bleed (something is chipping away at loyalty over time).
- Cohort-to-cohort comparisons. Compare cohorts side by side to see whether a specific change a new onboarding flow, a pricing update, a shift in ad spend-improved or hurt retention going forward. If every cohort after a given month performs worse, that’s a strong signal something changed for the worse around that time.
- Outlier cohorts. A cohort that performs unusually well or poorly is often your most useful data point. Find out what’s different about it—an acquisition channel, a product category, a promotion, and you may have found a lever worth pulling (or a mistake worth avoiding) for future cohorts.
You can also customize which metric populates the chart depending on what you’re trying to learn-percentage of customers who made a repeat purchase, average order value by cohort, or the share of customers who returned to the site without buying. Running the same cohort table with a few different metrics side by side often reveals more than any single chart on its own.
Customer Cohort Tracking: Key Metrics and KPIs
Monitoring the appropriate metrics for your business model is necessary for cohort analysis to be effective. Although every company has its own KPIs, several fundamental measures are always useful for comprehending the health and behavior of cohorts.
| Metric | What It Measures | Typical Goal |
|---|---|---|
| Retention Rate | % of a cohort that stays active (repeat purchases, logins, engagement) | Average repeat purchase rate is –28%; a healthy benchmark for a 1–3-year-old store is 30–35% |
| Churn Rate | % of customers who stop buying (track customer churn and revenue churn separately) | Non-subscription stores: 55-70% annual churn is typical; under 60% is healthy, under 50% is strong. Subscription ecommerce: 6.5–8.5% monthly churn on average, varying by category |
| Customer Lifetime Value (LTV) | Total revenue a cohort generates over its full relationship with your brand | Healthy ecommerce brands target an LTV:CAC ratio of at least 3:1 |
| Engagement Metrics | Session frequency, feature use, or content interaction that signals real engagement | Find your "aha moment"—the early action most linked to long-term retention and optimize onboarding around it |
| Monetization Metrics | Purchase frequency, average order value, time between purchases | Average ecommerce CAC sits at $68–$84, so the second purchase is the checkpoint that determines whether acquisition was even profitable |
Common Mistakes and Challenges in Cohort Analysis
Cohort analysis is an effective method. However, it has shortcomings and possible risks just like any other tool. These are typical problems that teams face, along with solutions.
- Incomplete or messy data
Cohort analysis is only as reliable as its inputs—missing signup dates, events tracked in one system but not another, and gaps between your marketing, product, and payment platforms all corrupt the results. Fix it by centralizing and timestamping key customer actions (orders, signups, campaign clicks) before you start analyzing.
- Tools that don’t fit your team
Cohort analysis used to mean spreadsheets and SQL, and many teams still avoid it because it feels too technical or their platform buries the feature. Start with whatever’s accessible—a simple spreadsheet works fine for a small store-and upgrade tools only once you outgrow it.
- Under- or oversegmenting
Too many cohorts shrink your sample sizes into noise; too few cohorts flatten meaningful differences into a single average. Start with basic time-based cohorts, add segmentation only to test a specific hypothesis (eg, “referral customers retain longer than paid-ad customers”), and treat any cohort under-30 people with caution.
- Misreading the data
The two most common traps are ignoring outside context (a holiday spike, a competitor’s sale) and mistaking correlation for causation (assuming a feature caused retention when it may have just attracted already-loyal customers). Treat cohort trends as hypotheses to test further-via A/B testing or customer feedback-not as conclusions, and annotate charts with campaign and product-launch dates for context.
- Analysis paralysis
Dozens of cohorts, each with its own curve, can bury you in data without producing a single decision. Anchor every cohort analysis to one specific question (e.g., Did the new checkout flow improve 30-day retention?), track a small set of core metrics like Month 3 retention and 90-day LTV, and review findings on a regular cadence so insights actually turn into action.
Conclusion
Cohort analysis is effective because it replaces broad averages with accurate information about specific groups of users over time. You can take action in onboarding, messaging, and the product itself by using nearly real-time behavioral data to determine where consumers find value and where they stray. Cohorts provide you with the what at scale, while interviews and feedback fill in the why.
If you need assistance with conducting customer cohort analysis and setting up effective segmentation, contact Flowium’s team. Our professionals will help you optimize your segments and develop an actionable marketing strategy for retention and growth.
Frequently Asked Questions
How often should I perform cohort analysis?
The frequency is determined by your growth stage and business model. Cohorts should be reviewed every week or every two weeks by rapidly expanding businesses or those testing new products in order to identify problems early and make rapid modifications. Businesses that are more established and have reliable products can review on a monthly or quarterly basis. Cohort analysis should always be used to assess the impact of significant product, marketing, pricing, or onboarding changes. Create alerts for when cohort performance significantly deviates from historical norms so you can look into problems right away, and set up automatic dashboards that continuously analyze cohort metrics so you can monitor trends without manual analysis.
Why is a cohort analysis important for reducing churn?
The precise times when users depart are concealed by aggregate analytics. By analyzing retention over time, a cohort analysis can identify the precise day or week that a particular user group starts to leave. This degree of specificity enables you to carry out focused interventions prior to users canceling.