Tracking, monitoring, and analyzing eCommerce KPI benchmarks is an integral part of any marketing, especially the digital one. Through monitoring, eCommerce brands can determine what works, where to adjust their strategy, and where to focus in order to grow. One such indicator is the customer lifetime value benchmark (CLV). The CLV benchmark is a key metric in the eCommerce field and a guide for future growth and expansion.
If you’re here, you already know what a CLV benchmark is and want to learn more about its average scores across industries, details on the optimal CLV rate, and insights on how to improve it. We’ll cover all of this in this article.
What is the Optimal Customer Lifetime Value Benchmark?
First and foremost, a customer’s lifetime value should not be viewed as a standalone benchmark. Knowing the typical revenue a brand can expect from a customer over a specific period does not equate to the brand’s revenue but serves other purposes for analysis. By knowing your CLV, you can compare benchmarks against industry standards and market averages. This CLV comparison provides context for evaluating your own results, helping you understand whether your CLV is lower than expected, meets expectations, or exceeds them.
The average CLV varies significantly depending on the industry, pricing model, and customer behavior, as you can see below in our study of average CLV by industry. For example, brands with relatively low prices, such as those in the food industry, may have a high CLV due to frequent purchases and repeat orders, while industries with high-value goods may show a high CLV simply because purchases are larger, not more frequent.
This means that a high CLV does not always indicate marketing success within specific industries. That is why comparing your CLV to the overall average across all eCommerce businesses is rarely useful. Instead, the most effective approach is to evaluate:
- Your CLV relative to specific industry benchmarks
- The growth of your CLV over time
- How your CLV compares to your customer acquisition cost (CAC)
By focusing on CLV, eCommerce brands can optimize their customer retention strategies, prioritizing the long-term relationship over short-term profits, which, while equally important, can diminish significantly over time.
Discovering Average Customer Lifetime Value by Industry
Now that we’ve clarified what good customer lifetime value is, let’s move on to your main concern. Brands typically look at average customer lifetime value in eCommerce to see how they’re performing compared to the industry average.
Figures are estimates and may vary significantly by business model.
The overall average customer lifetime value is ~$1,609. The CLV range for small, new stores is $50-$500. However! Without specifying a particular industry, these figures won’t be useful to you. There’s no need to get discouraged just yet if your figure is significantly lower. The CLV benchmark is quite precise and largely depends on what you sell, who you sell to, and how you do it. The difference in CLV from one industry to another can be significant, which is why you should start by focusing not on the overall average CLV across all industries, but at least on each one individually—and most importantly, on the one that applies to you.
That’s why we’ve prepared these average customer lifetime value (CLV) metrics for eCommerce to help you understand why it’s so important to analyze industries individually rather than in general, and to see just how significant the differences really are. The collected studies do not provide actual customer lifetime value figures by industry, but they do offer estimates based on other eCommerce performance metrics, which allow for the calculation of average CLV using a formula. Using this same formula, you can calculate your own metrics and compare them to the table of industry averages.
The formula is as follows:
CLV = Average Order Value (AOV) × Purchase Frequency per Year × Customer Lifespan.
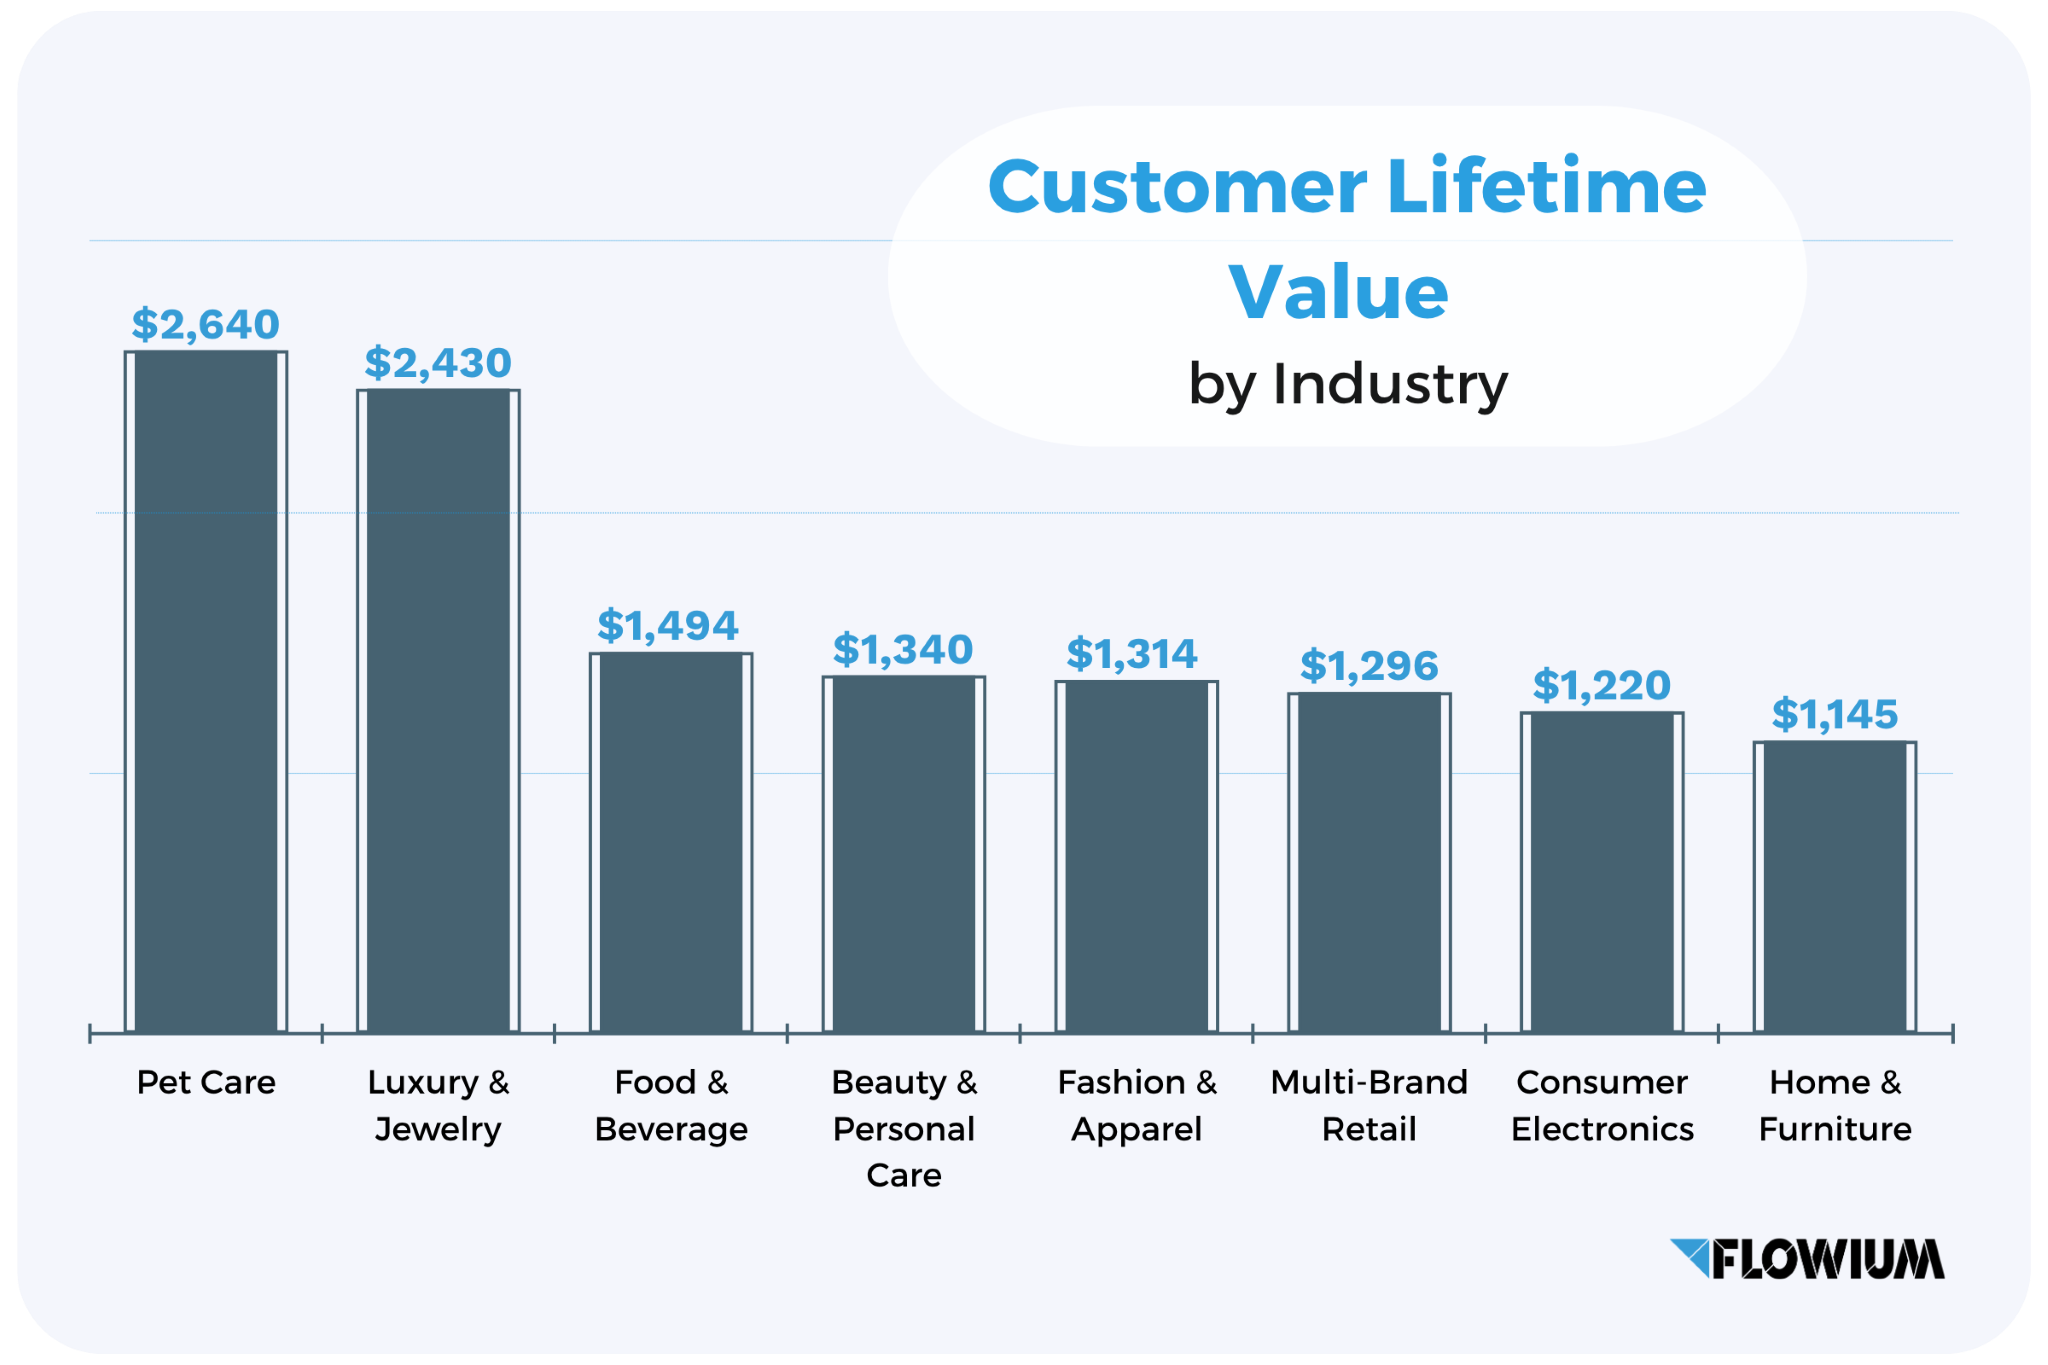
Your actual figures will vary depending on your customer retention efforts, product quality, pricing, and a dozen other factors. Below, you can view a table of average customer lifetime value by industry, calculated using our formula based on KPIs for eCommerce businesses.
| Industry | AOV | Purchases/Year | Customer Lifespan | Estimated CLV |
|---|---|---|---|---|
| Luxury & Jewelry | $324 | 1.5 | 5 years | $2,430 |
| Home & Furniture | $229 | 1 | 5 years | $1,145 |
| Electronics | $244 | 1 | 5 years | $1,220 |
| Fashion & Apparel | $146 | 3 | 3 years | $1,314 |
| Multi-Brand Retail | $108 | 4 | 3 years | $1,296 |
| Food & Beverage | $83 | 6 | 3 years | $1,494 |
| Beauty & Care | $67 | 5 | 4 years | $1,340 |
| Pet Care | $66 | 10 | 4 years | $2,640 |
Additionally, analyzing these statistics provides some general benchmarks for customer lifetime value in eCommerce:
$300-$1,200: the CLV range for most online stores
$1,000-$2,000: the customer lifetime value typical of strong brands
$2,000+ the customer lifetime value found in high-margin niche markets
Obviously, due to product prices and the need for frequent purchases, some industries have significantly higher metrics; however, these are not the only reasons for such discrepancies. CLV also depends to a large extent on:
- Product category
- Purchase frequency
- Customer loyalty
- Pricing model
- Brand positioning
High Average CLV Industries
The eCommerce industries, which, according to research, have some of the highest estimated CLV figures.
Pet Care (Estimated CLV: $2,640)
Pet care products are quite expensive items that need to be replenished regularly. The lowest average order value for pet products is $66. In addition to high metrics, this industry also has a significant drawback in the form of a 70% annual customer churn rate. The reason is that pet owners are constantly searching for the most affordable and convenient places to shop. However, the customers who remain are among the most loyal, shopping for years. The length of time a loyal customer stays with a pet care store can exceed 15 years.
Luxury Products and Jewelry (Estimated CLV: $2,430)
Luxury products and jewelry follow a somewhat similar pattern. The customer churn rate here is even higher, reaching as much as 75%, but the profit from loyal repeat customers is very high. Of course, this industry also has a high average purchase value of $324. The small percentage of loyal customers is very important, as they can potentially make 1-2 purchases per year, generating significant revenue. The maximum duration of customer loyalty for luxury products and jewelry can be as long as 30 years.
Food and Beverages (Estimated CLV: $1,494)
The customer churn rate in the food industry is significantly lower than in the other industries mentioned, at 64%, because if people like the products, they will become loyal on their own. The high churn rate is due to the many one-time purchases customers may make out of simple curiosity. The average order value is estimated at $83, but note that order frequency in this industry is quite high, with customers returning more than 6 times a year.
Mid CLV Industries
Industries with comparatively low average order values but a high purchase frequency result in a medium average lifetime value.
Cosmetics and Personal Care Products (Estimated CLV: $1,340)
Among all those mentioned, this industry has the lowest average order value at just $67, yet it also has the lowest customer churn rate, with only 62% of customers having the best chance of repeat purchases. Cosmetics and personal care products are items that need to be replenished regularly, about 5 times a year. In theory, the most loyal customers can stay with a cosmetics or personal care brand for 10-20 years.
Fashion and Apparel (Estimated CLV: $1,314)
The industry is seasonal but has a rather high customer churn rate of 71%, though not the highest. This is because customers often look for clothing of different styles without being tied to a specific store. Loyal customers may make frequent purchases 3-4 times a year, but stay with the brand for an average of only 3 years. The theoretical maximum customer loyalty can be 10 years if you manage to maintain their interest consistently.
Multi-Brand Retail (Estimated CLV: $1,296)
General eCommerce stores have a low average order value of $108 due to their wide range of products. However, successful retailers have strong customer retention rates, as favorable conditions for customers encourage them to shop with you, whether by earning bonuses or simply enjoying the customer journey. The theoretical maximum customer relationship in the multi-brand retail industry can be 10 years of regular purchases.
Low CLV Industries
Industries characterized by high customer churn rates combined with infrequent purchases result in a low lifetime value.
Home Goods and Furniture (Estimated CLV: $1,145)
The home goods sector has the same customer churn rate as the jewelry industry, at 75%. However, unlike jewelry, people don’t buy furniture as often on average, typically making purchases when furnishing a new home or occasionally when updating their home decor. We estimated the CLV over a 5-year period, but it could be higher, as some loyal customers may stick with furniture stores for up to 20 years.
Consumer Electronics (Estimated CLV: $1,220)
An industry with one of the highest customer churn rates, a staggering 82%. Most buyers don’t stick around for more than a single purchase of a phone or laptop. However, a well-developed customer loyalty strategy will encourage them to return again and again for attractive incentives. A few purchases, and they may stay with you for a long time. For how long? Some marketing experts estimate the duration of customer loyalty for electronics stores at a phenomenal 30-40 years, based on the fact that people buy electronics throughout their entire adult lives.
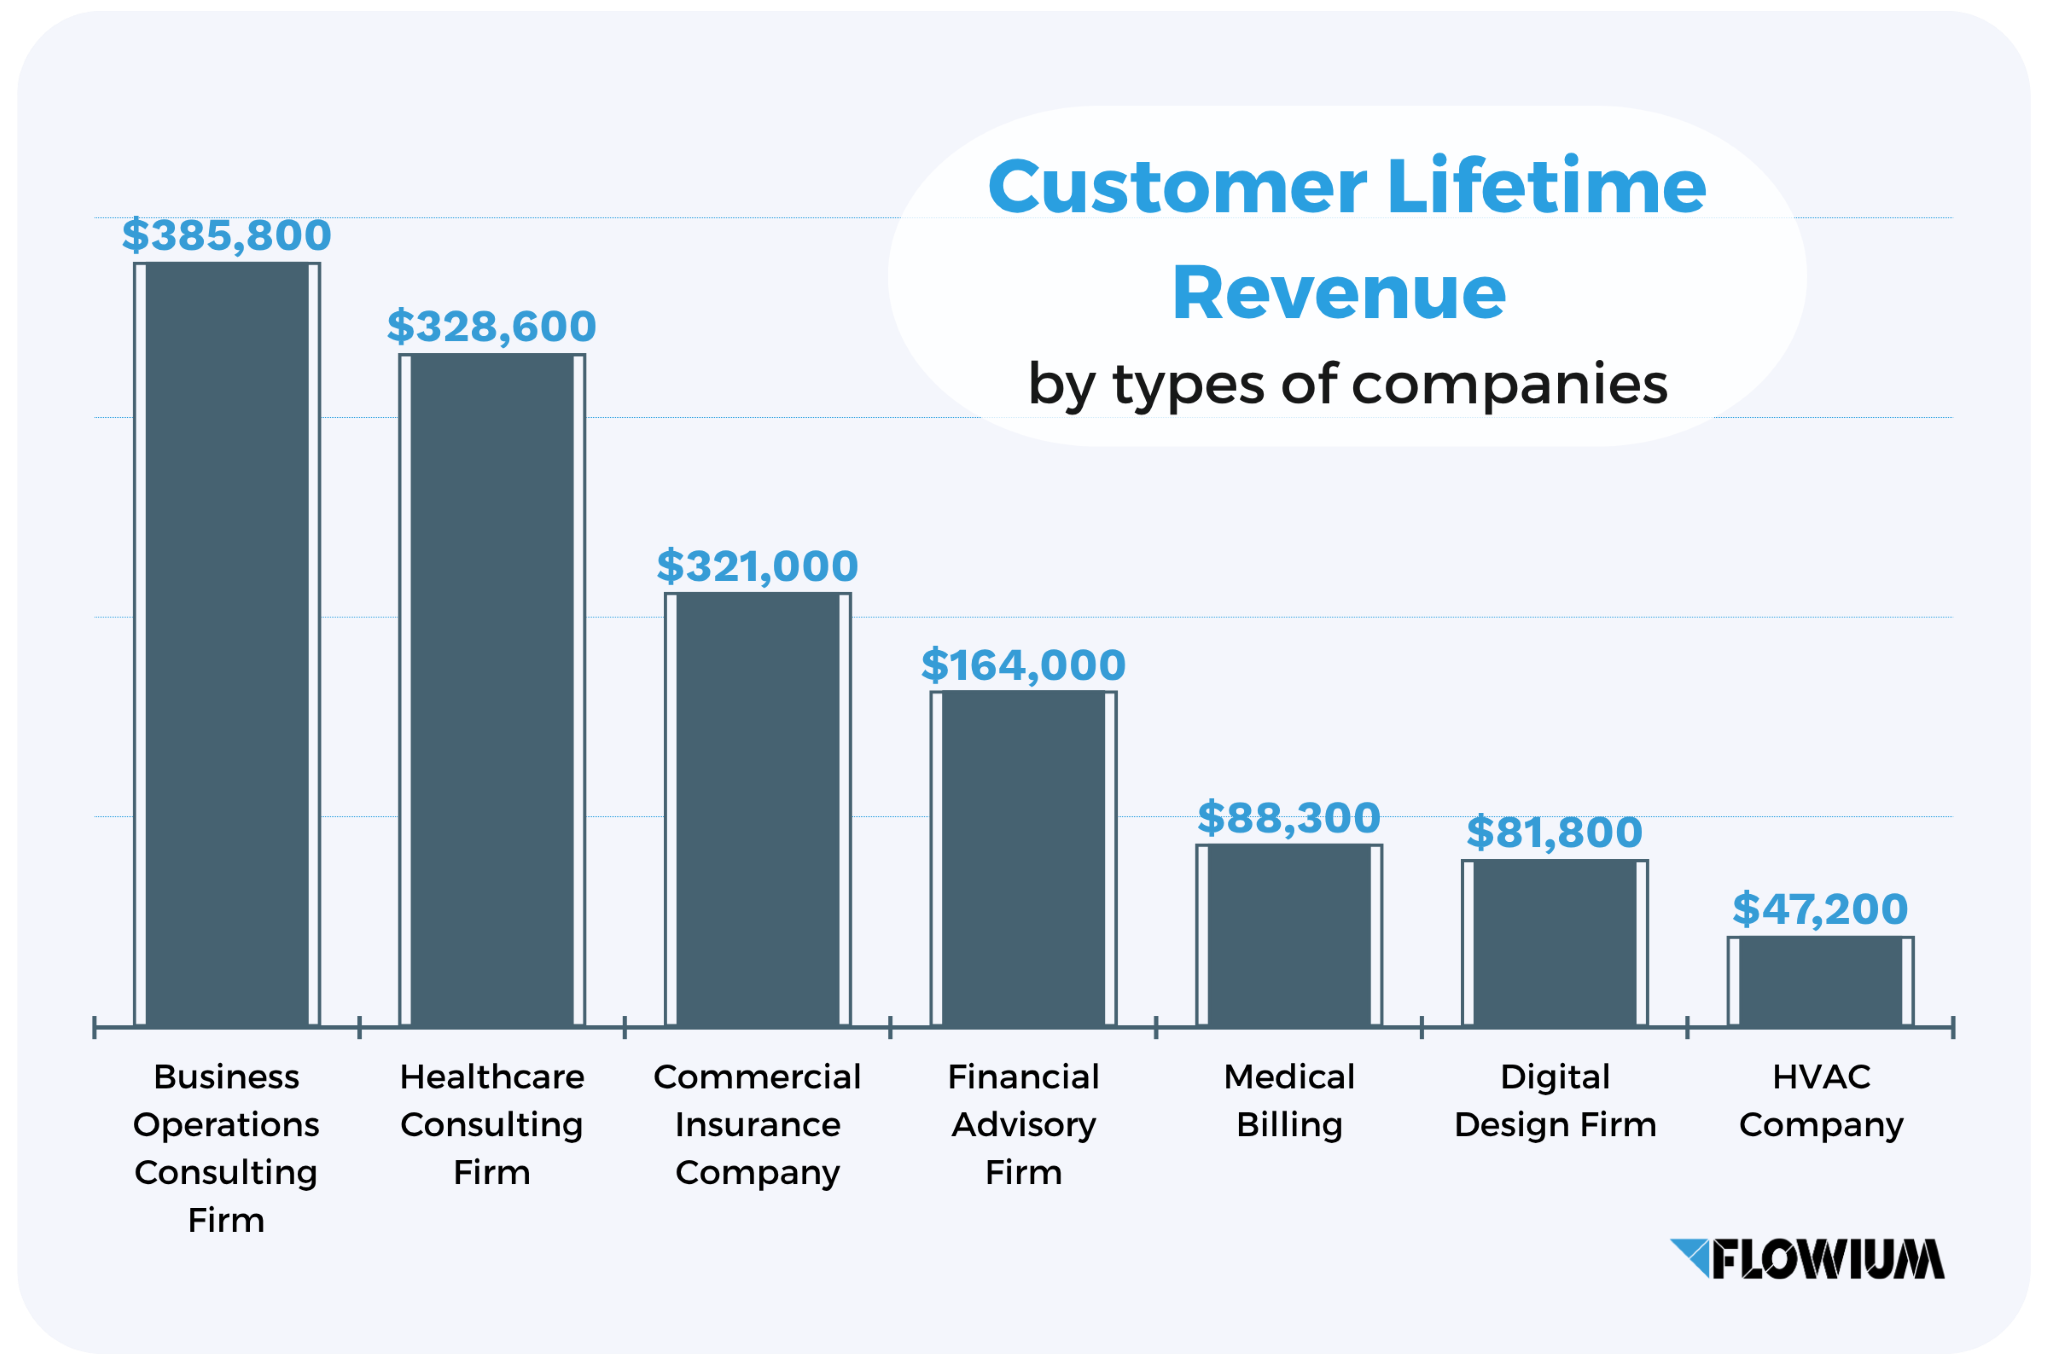
Customer Lifetime Revenue per Industry
The figures mentioned above are only approximate, as the average customer lifetime value is a complex and composite metric that requires a detailed analysis of various key eCommerce KPI benchmarks. For more accurate estimates and comparisons, there is a simplified benchmark: Customer Lifetime Revenue (CLR). When calculating CLR, various cost factors are not taken into account. It is designed to reflect the total revenue generated from a single customer. We have further researched and compiled average Customer Lifetime Revenue figures for different types of companies:
- HVAC Company: $47,200
- Business Operations Consulting Firm: $385,800
- Digital Design Firm: $81,800
- Financial Advisory Firm: $164,000
- Commercial Insurance Company: $321,000
- Medical Billing: $88,300
- Healthcare Consulting Firm: $328,600
The Link Between Customer Lifetime Value and Customer Acquisition Cost Benchmarks
Once you’ve calculated your CLV, there’s another important metric you need to calculate next: the customer lifetime value to customer acquisition cost ratio. Customer Lifetime Value to Customer Acquisition Cost Ratio (CLV:CAC) is one of the most important metrics for any eCommerce business. The correlation between customer lifetime value and customer acquisition cost allows you to assess how cost-effectively a company acquires and retains customers while maximizing long-term revenue. Customer acquisition cost reflects how much a company spends to acquire a new customer, including marketing, sales, and operational expenses.
These two metrics allow you to draw many conclusions, helping you determine how effective your investments in CAC are and whether you should invest more, lower your budget, or adjust your marketing strategies. The logic is obvious: the value a customer brings must significantly exceed the cost of acquiring them.
The ideal CLV:CAC ratio depends on the industry and business model, but it should be higher than 1. A healthy business model typically maintains a CLV-to-CAC ratio of at least 3:1. If CLV:CAC is 3 (or 3:1), it means that for every dollar spent on acquiring a customer, you’ll make three dollars from them in the future. This is good because it means that you’ll be profitable as long as you can keep up the marketing ROI.
✅ A high CLV indicates effective customer retention strategies, successful upselling, and overall customer satisfaction.
❌ A high CAC when compared to other indicators suggests inefficient investment and the risk of losing money on each customer.
We’ve already discussed the most effective ways to increase the CLV in the section above. To lower the CAC, companies can focus their efforts on:
- optimizing marketing channels
- improving targeting
- leveraging organic traffic
By balancing metrics and maintaining a 3:1 ratio, your company will scale effectively, your investments will drive growth confidently, and profitability will become increasingly sustainable over the long term.
Final Thoughts on CLV Benchmark
The CLV indicator represents the net profit your brand generates from each customer. Increasing it requires investment in retention marketing; however, some industries naturally have a higher CLV than others due to the characteristics of their products, giving them greater potential for investment in customer acquisition. These industries include: pet care, luxury goods & jewelry, food & beverages, beauty & personal care, and others.
The most important thing to know about CLV, which can often lead to negative profits, is that CLV is not a general indicator of your profit. It is a mistake to determine a brand’s overall profit based on CLV; such an approach can lead to losses. CLV primarily gives you an idea of how much customers want to stay with the brand. If you want to quickly and effectively increase CLV and strengthen customer relationships without unnecessary effort, you can reach out to Flowium, a retention marketing company that will boost revenue per customer by effectively leveraging your customer acquisition investments. Contact us now!