Customer churn is an unwanted but at the same time unavoidable part of any business, including traditional online stores and subscription-based ecommerce. While marketers and subscription operators can’t reduce customer churn to zero, they can use this ecommerce metric to identify the strengths and weaknesses in their processes. Understanding your churn rate also creates opportunities to improve retention, which is crucial for sectors like subscription ecommerce, which rely heavily on customer loyalty and ongoing relationships.
In this guide, we’ll cover the basics of subscription churn rate in ecommerce, show you how to calculate it, and outline industry-standard ways to improve it.
What Is Subscription Churn Rate in Ecommerce?
Subscription churn rate is the percentage of subscribers or recurring revenue that your business loses over a defined period, usually a month or a year.
For example, if you start the month with 1,000 subscribers and 50 cancel, your monthly subscription churn rate is 5%.
In ecommerce, this subscription churn is different from the customer churn rate of a regular online store. For ordinary ecommerce, a buyer who doesn’t return after their first purchase mainly affects the repeat-purchase rate. We differentiate it for subscription-based businesses because every cancellation removes predictable recurring revenue, so churn directly shapes growth, customer lifetime value (LTV), and ecommerce profitability.
Voluntary vs. Involuntary Churn
Total churn contains the most important metrics within, which are voluntary and involuntary churn.
- Voluntary churn happens when a customer decides to cancel, whether it’s due to the price, product fit, low usage, or a competitor.
- Involuntary churn happens when a subscription ends without that choice. Most often, it’s because of a failed payment due to technical issues like an expired card, insufficient funds, or a bank decline.
Pro Tip: The best practice is to track these metrics separately. Since they have different causes, they require different fixes. We recommend addressing voluntary churn with product, pricing, and cancellation-flow changes, and involuntary churn with ensuring your payment process is straightforward and technically refined.
Subscriber Churn vs. Revenue Churn
No matter the type of churn, it results in the loss of revenue. However, understanding the difference between these two metrics can give you a clearer view of what needs to be fixed to prevent it. While subscriber churn rate answers the question “How many subscribers did we lose?”, the revenue churn answers “How much recurring revenue did our subscriber losses remove?”
- Subscriber churn rate measures the number of subscribers lost in a set period in relation to the number of subscribers at the start of that period.
- Revenue churn rate measures the recurring revenue lost in a set period.
However, you need to remember that the two measurements can diverge. For example, if you lost subscribers who are mostly on low-priced plans, your subscriber churn might look high while revenue churn stays low. You can also balance the number of revenue churn with changes after plan upgrades, which should later be accounted for in your net revenue churn calculation.
Monthly vs. Annual Churn
We mentioned that the subscriber churn rate is measured over a certain time period. Most businesses measure it monthly and annually to get the most comprehensive picture.
- Monthly churn measures cancellations within one month.
- Annual churn measures losses over one year, but it’s not simply your monthly churn times 12. This term actually has two meanings, so we need to differentiate them.
- Annualized churn is monthly churn compounded over 12 months.
- Annual-plan churn is the share of customers on annual plans who don’t renew their subscriptions.
The direct correspondence between your monthly and annualized subscriber churn can look the following way.
| Monthly Churn | Annualized Churn (compounded) |
|---|---|
| 3% | approx. 31% |
| 5% | approx. 46% |
| 7% | approx. 58% |
| 10% | approx. 72% |
Ecommerce brands mainly use monthly churn for subscription boxes and replenishment programs, where customers decide every cycle. Annual or renewal rate is more suited for memberships and annual plans, where losses cluster at the renewal date.
Skips, Pauses, and Cancels: How They Affect Measurement
A skip, a pause, and a cancellation in a subscription are all different events, and counting them inconsistently will lead to a distortion of your churn rate. So while monitoring and calculating, you need to be aware of the differences and how the three affect your final results.
- A skip is when a customer misses one order but stays subscribed. Then most teams don’t count it as churn.
- A pause is when a customer puts their subscription on hold for a defined time. In this case, you need to decide whether paused subscribers count as active, and apply this decision consistently during all your future calculations.
- A cancel is when the subscription ends (voluntary or involuntary). This event definitely counts as churn.
Pro Tip: While treating a pause as an active subscription is normal for many teams, we don’t recommend doing this with long pauses. It can hide churn for some time, but they will later appear as cancellations. The best practice here is to define a set period for a pause to be still considered one, and a specific point in time after which it becomes a churn.
How to Calculate Subscription Churn Rate
To calculate your subscription churn rate, you need to know the number of subscribers who left by the end of the set period and the total number of subscribers at the beginning of that period. Apply these numbers to the following formula:
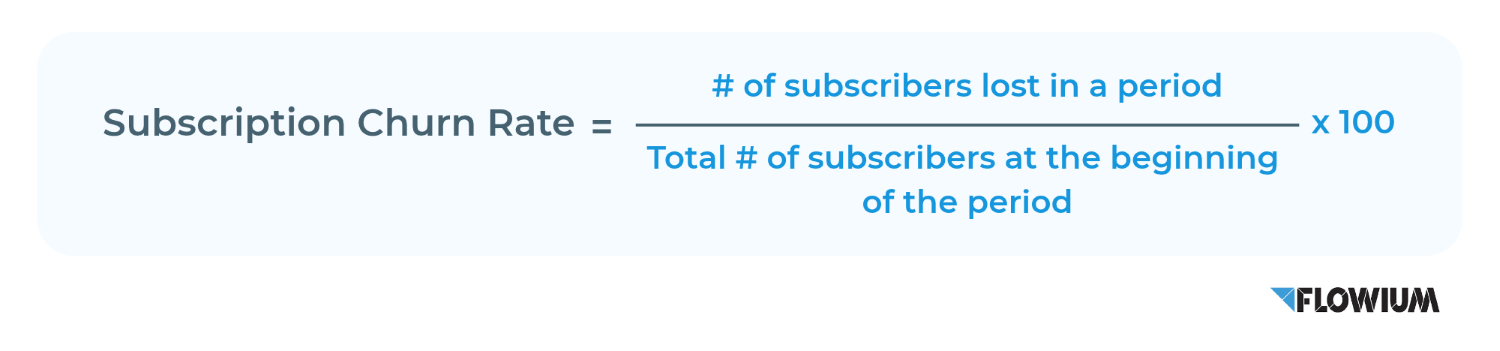
While this formula is effective for showing the general churn rate, as we mentioned before, it doesn’t fully represent your absolute subscription and revenue losses due to the factors that can offset this measurement.
We also recommend calculating voluntary and involuntary churn separately, then adding them to a total churn to get a complete overview of churn-related issues and possible causes.
Subscription Churn Calculation Example:
Let’s think of an illustrative scenario in which a coffee subscription brand starts its month with 2,000 active subscribers.
During the month, the brand sees 90 voluntary cancellations and 40 involuntary cancellations due to failed payments, making it 130 total cancellations.
To find out the churn rate, let’s use the formula:
Subscribers lost / Subscribers at start x 100%
When we apply our known numbers to the formula, we get:
Customer churn = 130 / 2,000 x 100% = 6.5%
- Voluntary: 90 / 2,000 x 100% = 4.5%
- Involuntary: 40 / 2,000 x 100% = 2.0%
Other Types of Churn to Measure for Subscription Ecommerce
To get a complete picture of your retention efforts and ecommerce performance, you also need to calculate other relevant churn metrics.
Revenue Churn
We already outlined that this metric measures whether a given cohort of recurring revenue is retained over a set period. This isn’t a subscriber-specific measure, but it provides an important context for other calculations such as net revenue churn.
To find this measurement, you need to know the amount of revenue lost at the end of the defined period and the total monthly recurring revenue at the start of the period. Then use these numbers in the following formula:
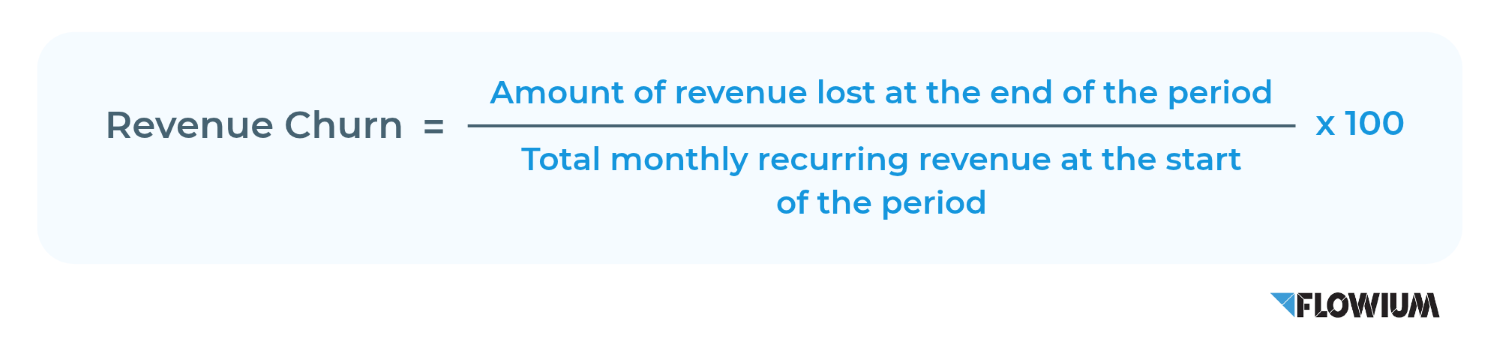
The subscriber churn rate formula is easy to apply and gives a quick sense of customer attrition.
Example:
Let’s say that the same coffee subscription brand has a monthly recurring revenue (MRR) of $60,000 (average subscription is $30). The 130 cancellations amounted to $4,500 in revenue loss (some lost subscribers had more expensive plans).
When we apply this formula:
MRR lost from cancellations / MRR at start x 100%
We get the result for this brand:
Revenue churn = $4,500 / $60,000 x 100% = 7.5%
As you can see, it’s higher than subscription churn in the previous example (6.5%) because the cancelling subscribers were worth more than the average fee.
Gross Revenue Churn
Gross revenue churn, or gross MRR churn, measures a percentage of your recurring revenue lost due to cancellations or plan downgrades.
You can calculate it after finding the total revenue churn by using the formula below.
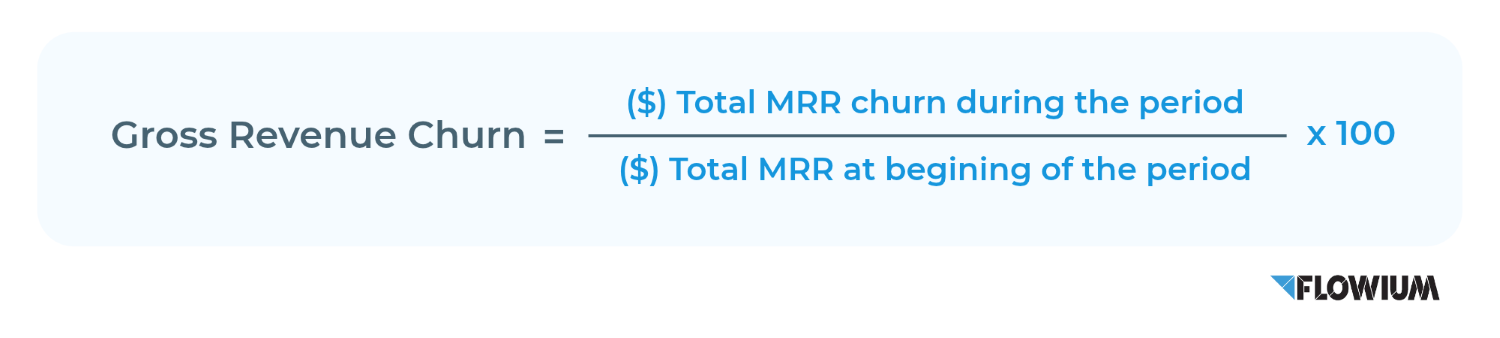
This metric counts every dollar lost, including downgrades, and ignores any revenue gained. It can’t go below 0%
Example:
Using the example of the same brand, let’s say that they experienced $600 of revenue loss due to plan downgrades (for example, a subscriber buying 1 bag of coffee instead of 2).
Using the formula and applying the previously known numbers:
(Churned MRR + Contraction MRR) / MRR at start x 100%,
We can calculate gross revenue churn for this business:
Gross revenue churn = ($4,500 + $600) / $60,000 = $5,100 / $60,000 x 100% = 8.5%
Net Revenue Churn
We briefly mentioned that net revenue churn involves tracking changes after plan upgrades separately. To be precise, it measures a percentage of recurring revenue lost to downgrades and churn after subtracting expansion revenue (plan upgrades and upsells) from the total revenue at the end of the period and dividing the result by the MRR at the start of the period.
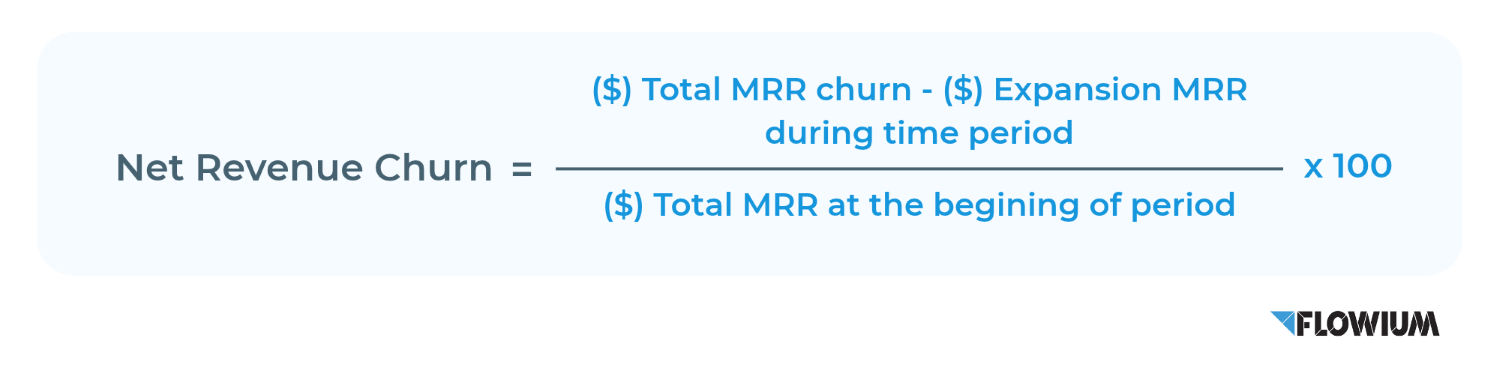
Net revenue churn credits upgrades and add-ons against the losses.
Example:
If the same brand had $1,500 of added revenue due to plan upgrades and add-ons. We can add this number while calculating net revenue churn using the formula:
(Churn MRR + Contraction MRR – Expansion MRR) / MRR at start x 100%
In the result, we get:
Net revenue churn = ($4,500 + $600 – $1,500) / $60,000 x 100% = $3,600 / $60,000 x 100% = 6.0%
It’s also important to note that negative net churn is possible. For this brand, it could’ve happened if expansion had been $6,000. Then, according to the formula, we’d get net revenue churn of -1.5%, meaning that the existing base grew in revenue even after losing subscribers.
Annualized Churn Rate
If you also want to know your annualized churn rate, it is calculated from the monthly churn rate. The annual churn rate offers a view of long-term trends, helping evaluate the success of your retention strategies.
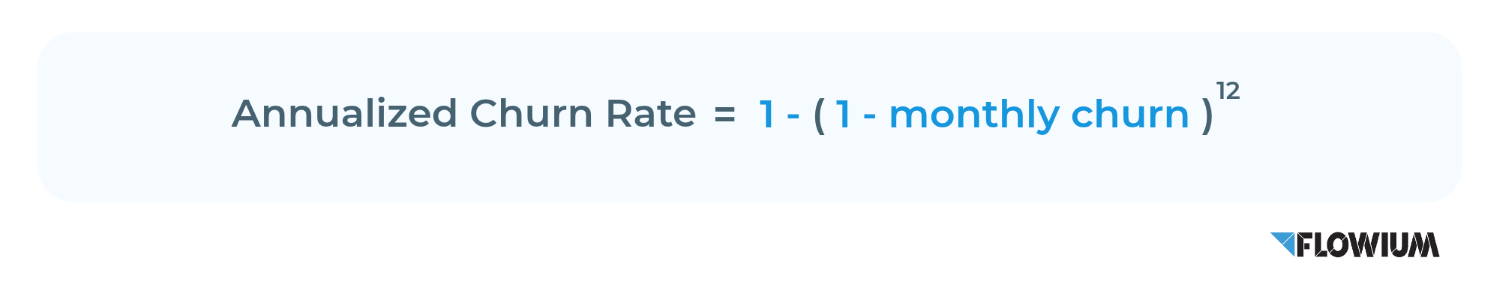
It’s crucial to use this formula instead of simply multiplying your monthly subscriber churn by 12, which ignores compounding. You can annualize each churn metric we mentioned above.
Example:
Let’s take the monthly subscriber churn of 0.065 (the result we got before turning it into percentages) for our illustrative business and annualize it to show you the method.
Annualized churn rate = 1 – (1 – 0.065)^12 = 1 – 0.935^12 = 1 – 0.446 = 0.554
If you want to get the final measurement in percent, just multiply your result by 100%:
0.554 x 100% = ~55%
Ecommerce Subscription Churn Rate Benchmarks 2026
Average churn rate for ecommerce subscription brands is roughly 5–8% a month, which annualizes to about 46–63%. Curated subscription boxes run higher, at around 10–15% a month.
Let’s look at some relevant 2026 statistics to see what subscription churn rates most businesses actually get in this ecommerce sector.
- Finsi’s 2026 report puts the ecommerce average churn at 6.5–8.5% monthly and states that voluntary churn makes up 65–75% of total churn in subscription boxes.
- According to RecurX, monthly churn of 5–7% is typical for consumer product subscriptions, under 5% is strong, and above 10% signals a structural problem. Involuntary churn accounts for roughly 20–40% of total churn, and well-organized recovery flows win back 40–70% of failed renewals.
Subscription Churn Rate Benchmarks by Ecommerce Category
Platform DTC’s update in August 2026 lists average subscription churn for supplements and consumables at 5–8%, pet products at 6–10%, meal kits at 8–15%, and general subscription boxes at 10–15%.
Let’s look at a 2026 cross-platform subscription churn benchmark synthesis that we created from the mentioned sources.
| Category | Monthly Churn | Annualized (calculated by Flowium) |
|---|---|---|
| Supplements/Consumables | 5–8% | ~46–63% |
| Coffee | 5–10% | ~46–72% |
| Pet Products | 6–10% | ~52–72% |
| Health & Wellness | 8–12% | ~63–78% |
| Beauty & Personal Care | 8–14% | ~63–84% |
| Meal Kits | 8–15% | ~63–86% |
| Apparel Boxes | 10–15% | ~72–86% |
| Lifestyle/Home Boxes | 10–15% | ~72–86% |
| General Subscription Boxes | 10–15% | ~72–86% |
Average Subscription Churn Rate by Billing Frequency
Longer billing cycles churn less. According to Recharge’s quarterly report in August 2026, annual plans churn roughly 3x less than monthly plans.
| Billing interval | Share of Subscribers | Cumulative Lifetime Churn |
|---|---|---|
| Monthly | 60.7% | 84.2% |
| Quarterly | 14.7% | 67.7% |
| Annual | 3% | 30.1% |
Note that these numbers are directional rather than periodic rates since they are cumulative figures that cover both cancellations and failed payments.
Churn by Subscriber Tenure
Most subscription churn happens early. If we look at the data in the same Recharge report that we mentioned, we can see the correlation between the number of a subscription renewal cycle and voluntary churn.
| Renewal Cycle | Voluntary Churn |
|---|---|
| 2 (first renewal) | 24.1% |
| 3 (peak) | 27.1% |
| 4 | 16.6% |
| 6 | 10.1% |
| 12 | 5.4% |
| 13+ | 2.4% |
Note: These are generalized numbers across subscription-based businesses. We use these statistics to illustrate a common tendency, but you need to remember that they might differ depending on the category.
Another report by Yocto shows how many subscribers actually stay after each order, as well as benchmarks for ecommerce subscription brands. From the table in the report, we can also calculate approximate churn by order retention.
| Order Number | Low | Median | High |
|---|---|---|---|
| 3rd order | 17% | 33% | 51% |
| 4th order | 34.4% | 44.7% | 76% |
| 5th order | 42.2% | 59% | 86.1% |
| 6th order | 51.5% | 65.9% | 90.4% |
Note: These are approximate rates reversed and calculated from the retention statistics for subscription ecommerce brands presented in the Yocto report.
Yocto states that the typical brand walks about a third of its subscribers all the way to a sixth order. The best keep nearly half. The weakest keep one in ten.
The two reports measure different things (Yocto shows the cumulative share of subscribers gone by each order, while Recharge shows when voluntary cancellations happen), so their numbers aren’t directly comparable. However, they both outline the same tendency: the steep losses happen between the second and fourth orders, and a subscriber who makes it to the fourth rarely leaves before the sixth. Most of the subscriber loss happens early.
What is a “Good” Subscription Churn Rate for Ecommerce?
A good monthly churn rate for an ecommerce subscription is roughly 5–7%, and anything under 5% is considered strong. That annualizes to about 46–58% of subscribers lost per year.
What counts as good depends heavily on your business model. For example, replenishment subscriptions are expected to churn less than curated boxes.
Overall, there is no one-size-fits-all approach for a “good” subscription churn rate that should apply to all industries and businesses.
Ideally, achieving a negative churn should be your ideal outcome as it indicates that a business’s revenue from an existing customer exceeds the revenue lost to cancellation or downgrades.
How to Know If Your Ecommerce Subscription Churn Rate is Good?
Here we share a simple step-by-step instruction on how to benchmark your own subscription churn:
- Compare measurements to benchmarks for your specific ecommerce segment and model (replenishment vs curated boxes)
- Split voluntary and involuntary churn and compare to industry standards to identify issues.
- Take into account your price tier and compare your measurements to brands with similar structure and pricing since businesses with low-priced plans tend to have higher churn.
- Build cohort curves (churn by cycle number) rather than one blended rate.
- Track the trend instead of making decisions based on a single snapshot.
Why Do Subscribers Churn in Ecommerce?
Voluntary churn actually starts before your subscriber presses that “Cancel” button. Ecommerce subscribers voluntarily churn for a few main reasons:
- Price sensitivity. The cost of your product outweighs the received value for subscribers.
- Poor value realization. If you don’t show your customers the whole value of your product through a welcome sequence with product introduction and how-to emails, they are more likely to churn soon.
- Onboarding gap. Poor onboarding experience can significantly reduce engagement and lead to subscription cancellations.
- Poor customer support. When you don’t address issues promptly, it leads to customer dissatisfaction and diminishes trust in your services and products.
- Lack of engagement. Little to no communication after the first order can make your subscribers feel neglected and undervalued, leading to churn.
When it comes to involuntary churn, we already defined that the main cause for it is failed payments. You need to understand that this type of churn means that the customer never decided to leave but rather fell out of the loop because of technical issues. Count this churn separately and apply effective strategies to recover it.
How Can Ecommerce Brands Reduce Subscription Churn?
Ecommerce brands reduce subscription churn by reaching subscribers before they cancel. Usually, it’s done through guiding the first orders, watching for disengagement signals, personalizing shipments, and acting on feedback. The timing of your actions matters especially. Here are some more detailed tips on preventing subscription churn from our marketing professionals:
- Onboard through the first orders. Send a welcome sequence that introduces your product and sets expectations. Include useful information such as what ships when, how to use your product, and how to manage order frequency.
- Keep up engagement between subscription renewals. If you have longer renewal cycles, make sure to contact your subscribers with promotional or informational materials in between re-orders. This will prevent them from feeling forgotten and open up opportunities for upgrades/upsells.
Pro Tip: Consider the right frequency for this type of message. Bombarding your subscribers who have, for example, a monthly reorder with emails and SMS reminders can cause promotion fatigue and churn as a result.
- Watch behavior before cancellations. By monitoring for rising skips, paused orders, lower engagement, and visits to your cancel page, you can see risk signals before cancellations. Set up a re-engagement flow or an easy frequency change triggered by one of those actions.
- Personalize based on purchase history. Base recommendations, swaps, and add-ons on order history and lifecycle stage. Offer flexible cadence so the schedule matches how fast they use the product.
- Deliver what’s promised and show value. Set realistic expectations right at the signup stage, then reinforce them by sending updates and next box previews to keep the value visible.
- Close the feedback loop. Collect feedback through surveys and support tickets to identify the main reasons for churn, fix them, then tell customers what changed.
Read our guide on the best ecommerce subscription retention strategies to find more effective practices and professional tips.
Conclusion
Once you start monitoring your subscription churn rate and know what rates are acceptable in the industry, you can easily compare them to identify issues and set clear goals as a part of your subscription retention strategy.
If you’re struggling to reduce subscriber churn through your own efforts, schedule a consultation with Flowium and we’ll help you map the issues leading to cancellations. You can also request a free marketing audit to identify gaps in flows, segmentation, analytics, and subscriber communication.
Frequently Asked Questions
What is a good monthly churn rate for a subscription box?
A good monthly churn rate for curation-driven subscription boxes is typically 10–15% monthly. It’s higher than replenishment subscriptions because retention depends on every box re-earning its place. Boxes under 10% monthly churn are performing strongly, though ideal targets vary significantly by industry and business model.
What is the average churn rate for subscription services in ecommerce?
The average monthly churn rate for ecommerce subscription businesses in 2026 is 5–8%.
Is 10% monthly churn bad?
While 10% monthly churn isn’t critical and is considered normal for some categories, it is above the ecommerce average, normal for curated boxes, and a warning sign for replenishment brands. You need to monitor the dynamics of this metric and compare it with benchmarks in your ecommerce vertical.
How often should I measure subscription churn?
You can choose the timeframe for which you want to measure churn. It could be monthly, quarterly, or annually. The choice often depends on your business cycle and how often you want to assess your performance.