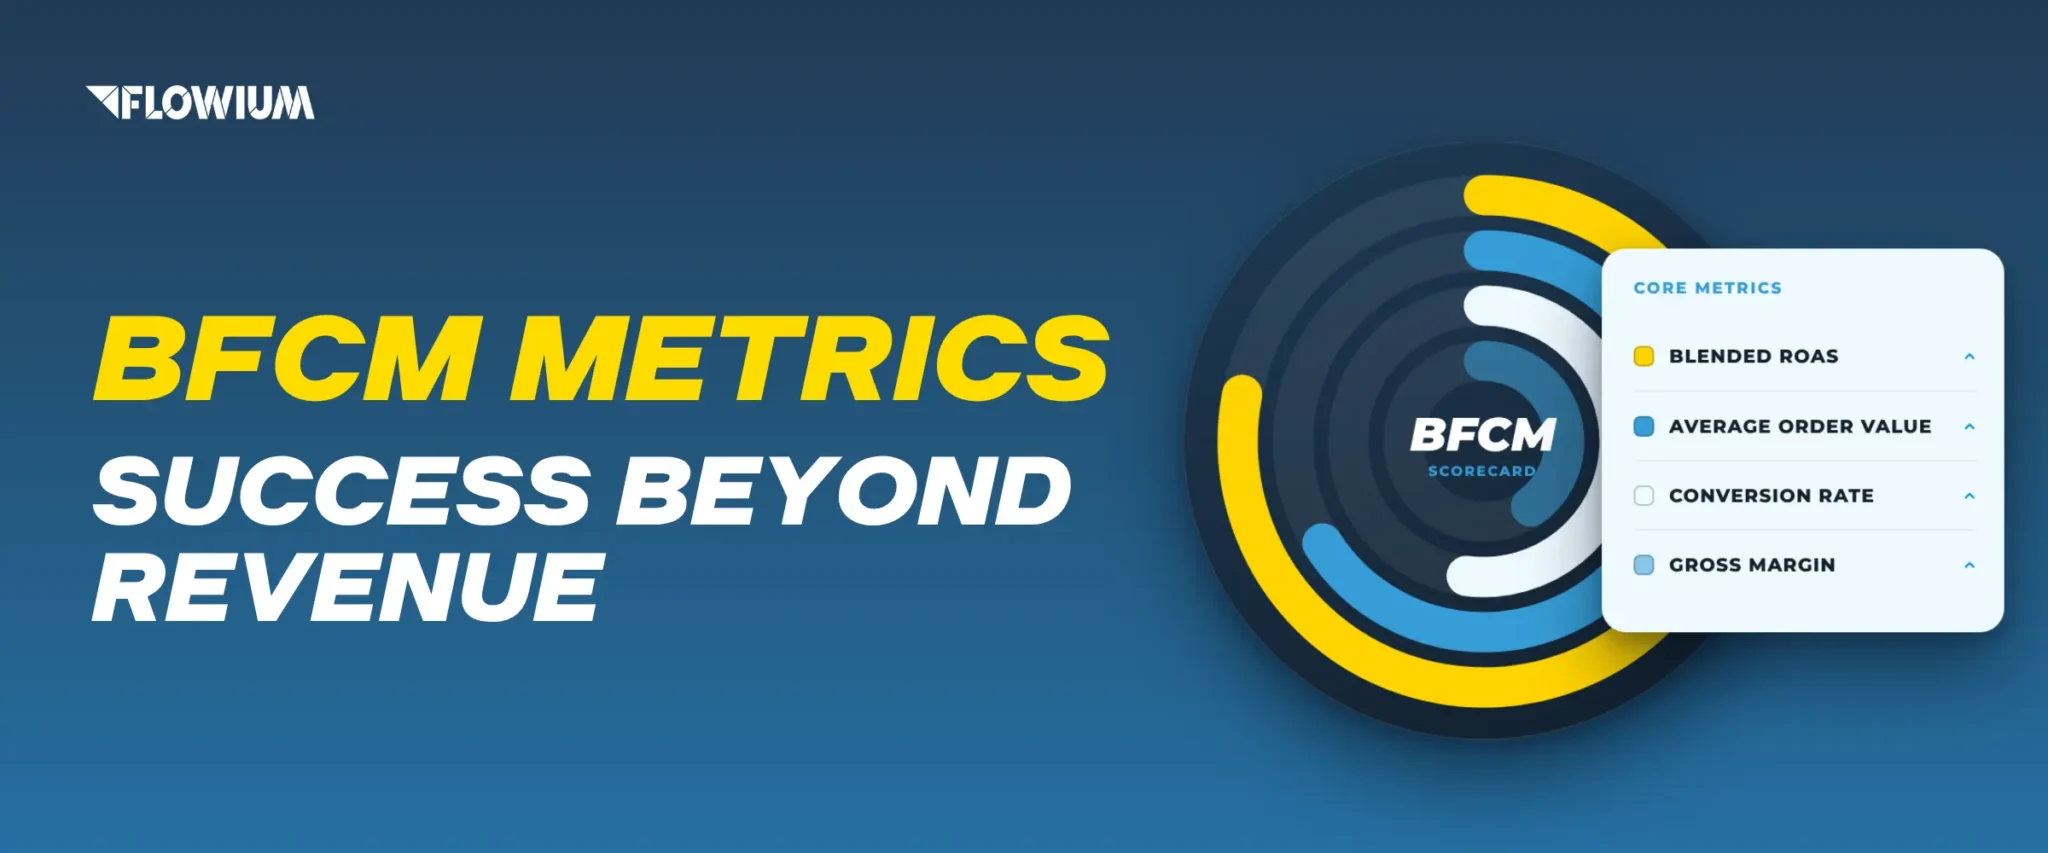
Every year, BFCM metrics come down to one number: revenue. But revenue is a lagging indicator since it only shows how much you sold, not how many new customers you won or whether they will buy from you again. Two brands can both finish BFCM at $5 million, and a year later one has doubled while the other has barely grown. The difference is what happened to the customers who placed their first order during the sale weekend.
This is why it’s better to measure BFCM as one of the biggest customer acquisition events of the year, not just a four-day sale. Retention starts the moment someone clicks “Place order”, not after the weekend ends. In this guide, we’ll give you a checklist of BFCM metrics that really work for measuring the true impact of your marketing and retention.
What Are BFCM Metrics?
BFCM metrics are the numbers ecommerce teams track to judge how their Black Friday Cyber Monday sale and promotions performed. They cover revenue, profit, customer acquisition, and engagement with those customers after the order.
The most useful BFCM metrics look beyond revenue during the sale weekend. For example, customer and retention metrics show whether the sale built a base of buyers who come back, which is key for sustainable business growth.
Why Revenue Is Not Enough to Measure BFCM Success
Revenue alone isn’t enough to measure Black Friday marketing success because it counts sales without showing their profit, their source, or whether buyers return. Two brands can report the same BFCM revenue and end up with very different results, depending on discount policy, new customer share, return rates, and repeat purchases.
Every year, BFCM brings a unique mix of customers: your existing clients, first-time purchasers lured by exclusive deals, and seasonal gift-givers who will never interact with your brand again. The problem with revenue as a BFCM metric is that it lumps these customer types together, showing only the total result, while each type requires a specific approach. Understanding who’s who, what they cost to win, or which of them will order again is essential for building an effective retention strategy.
What a revenue total doesn’t show:
- Ecommerce profit. Heavy discounts, shipping costs, and ad spend can leave a high-revenue weekend with a thin contribution margin.
- Customer mix. Revenue from existing customers who would have bought anyway and revenue from first-time buyers are different from the marketing POV.
- Acquisition cost. A sale that costs more in ads than the first order returned needs later purchases to balance books.
- Returns and refunds. Gift purchases and deal-driven orders tend to be returned more often, so gross revenue can overstate what you get to keep.
- Future value. Revenue says nothing about a second-purchase rate or lifetime value of the segment of customers that BFCM brought in.
Vanity Metrics vs. Predictive BFCM Metrics
Vanity BFCM metrics describe what happened during the sale. Revenue, order count, traffic, and conversion rate are examples of vanity metrics. While they are useful for a first read and can look strong in reports, they don’t give you complete insights into the efficiency of your strategy and overall sales success.
Predictive BFCM metrics are what you need to connect the sale weekend to future revenue, as they indicate what those customers are likely to do and to be worth for your business afterward.
Read our guide on leading and lagging indicators to learn more about the difference and its importance for ecommerce.
| Vanity BFCM metrics | Predictive BFCM metrics | |
|---|---|---|
| What they show | Sale-weekend volume | Likely post-sale customer value |
| Examples | Total revenue, order count, site traffic, conversion rate, social engagement | Second-purchase rate, time to second order, new customer share, first-order profit, cohort LTV, return rate |
| When you see them | During the sale | Days to months after the sale |
| Main risk | Rewards discounting and volume | Needs tracking set up before the launch |
While keeping track of vanity metrics can be useful for the overall view and marketing reporting, we recommend prioritizing predictive BFCM metrics to get valuable insights ready to be implemented into data-driven, actionable tactics.
The Core BFCM Metrics to Track
The core BFCM metrics include both vanity and predictive metrics, with a focus on the latter, to give a complete picture of the sale’s performance. Together they show how much you sold, who bought, what it cost, and what you kept. Track each one before, during, and after the sale, and compare it first to your prior year and then to industry benchmarks.
| Metric | What it tracks | When to track | Ecommerce benchmark (2025 data) |
|---|---|---|---|
| Revenue and Orders | Overall sale size and whether growth comes from more buyers or bigger orders | Hourly during the sale; final read at day 7 | Year-over-year growth |
| Average Order Value | How much customers spend per purchase | Daily, by offer and device | $172 (generalized) |
| Conversion Rate | How well traffic turns into purchases | Hourly, by traffic source | About 4% to 6% |
| Customer Acquisition Cost | What it costs to win new customers | Daily during the sale; final at day 30 | From $58 to $250 (varies by category) |
| Blended ROAS | Overall ad efficiency across all channels | Daily | Roughly 3:1 or higher, set by margin |
| Gross Margin After Discounts | How much profit the sale kept after promotions and product costs | Before launch, then weekly | Category-dependent; 40% to 70% before discounting |
Revenue and Orders
Revenue is total net sales during your BFCM window, and orders are the number of
completed purchases. Together they show the size of the sale and whether growth came from more buyers or bigger baskets.
When to track: Monitor hourly on Black Friday and Cyber Monday to catch stock-outs and checkout issues. Take a final read about seven days after the sale, once returns and cancellations have been posted. Define the window (for example, Thursday through Cyber Monday) before launch and keep it the same each year.
Benchmark: Year-over-year change of your brand’s KPIs is the most reliable comparison. For context, Shopify merchants generated $14.6 billion during BFCM 2025, up 27% year over year.
Average Order Value (AOV)
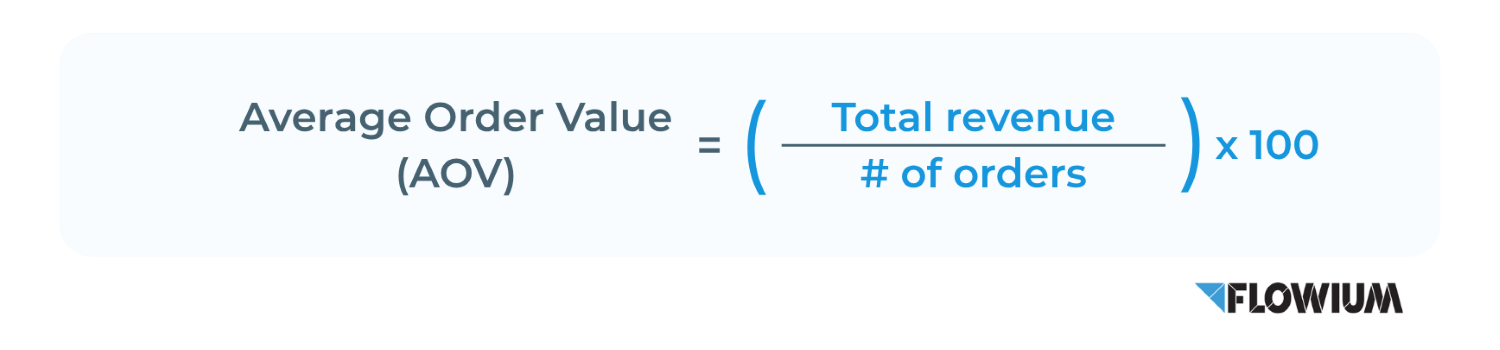
Average order value (AOV) is revenue divided by the number of orders. Discounts, bundles, free-shipping thresholds, and gifting behavior all move it.
When to track: Check daily, and segment by offer, device, and new versus returning customers. An overall AOV can hide a deep-discounted hero product pulling the average down.
Formula:
Benchmark: Omnisend reported SMB AOV rising from $164 in 2024 to $215 in 2025. Treat a flat AOV as normal and compare it to your own prior year.
Conversion Rate
Conversion rate is the share of sessions that end in a purchase (orders ÷ sessions). It rises during BFCM because shoppers arrive with high intent.
When to track: Watch hourly during the sale, split by traffic source, device, and landing page. A sudden drop usually points to a site, stock, or checkout problem you can still fix.
Formula:

Benchmark: Expect roughly double a normal day. Shopify data puts average Black Friday conversion at 5.86%, against a 2.8% annual average. A reasonable target range is about 4% to 6%, adjusted for category and mobile share.
Customer Acquisition Cost
Customer acquisition cost (CAC) is acquisition spend divided by the number of new customers. For BFCM, use new-customer CAC (NCAC) rather than a blended figure, since blended CAC can hide the real cost of winning first-time buyers.
When to track: Calculate daily during the sale for pacing, then finalize 30 days after, when late attribution has settled. Compare against first-order profit and the 90-day repeat rate.
Formula:

Benchmark: Ranges vary widely by source and vertical. First Page Sage’s benchmark set puts ecommerce CAC at $53 to $91, while another review cites $45 to $250 or more depending on vertical, margin, and channel mix. One analysis reports CAC up 40% since 2023. A common health check is recovering CAC within 3 to 6 months at an LTV:CAC ratio of 3:1 or better.
Gross Margin After Discounts
Gross margin after discounts is net revenue minus product costs, divided by net revenue, with promotions already subtracted. It shows what the sale actually earned. For a fuller view, contribution margin subtracts fulfilment, shipping, payment fees, and returns, then marketing.
When to track: Calculate it before launch for each offer, then review weekly through January as returns arrive. Use effective discount rate (total discount dollars ÷ gross revenue), not the headline banner percentage.
Formula:

Benchmark: Starting margins differ by category: beauty runs about 50% to 70% and apparel about 40% to 60%. The discount math is unforgiving: a 20% discount at a 60% gross margin needs a 50% lift in units just to hold gross profit flat. For context, average Cyber Week discounts were about 28% in the US, versus 23% across the full November- December season.
Blended ROAS
Blended ROAS (also called marketing efficiency ratio, or MER) is total revenue divided by total ad spend across all channels. It avoids over-crediting any one platform during a period when channels overlap heavily.
When to track: Check daily during the sale and again at the end. Since BFCM ad costs rise, set a break-even ROAS beforehand: 1 ÷ your gross margin after discounts.
A brand with a 40% margin after discounts needs 2.5:1 just to cover product costs, before shipping and fees.
Formula:

Benchmark: There is no single published BFCM standard. One analytics guide flags that a ROAS under 3:1 may mean you are overspending relative to the return. Use roughly 3:1 as a starting reference, then replace it with your own break-even figure.
The BFCM Retention Metrics That Predict Long-Term Growth
BFCM retention metrics measure how many customers acquired during Black Friday Cyber Monday come back, how quickly, and how much they’re worth over time. They are the predictive half of BFCM measurement. They show whether the sale built a customer base or only pulled forward demand.
BFCM buyers tend to behave differently from the rest of your client base. One retention analysis puts it as it is: BFCM is a timestamp on a cohort, not just a campaign, so tag the cohort and measure it from blended numbers. Without a tag applied at the time of purchase, it’s hard to measure cleanly afterward.
| Metric | What it tracks | When to check | Benchmark |
|---|---|---|---|
| New vs. Returning Customer Split | Who the sale actually brought in | Sale end | Varies depending on acquisition and retention strategy; check your YoY dynamic |
| Repeat Purchase Rate | Share of new buyers who order again | 30, 60, and 90 days after the sale | Average for ecommerce is around 19%, lower for BFCM cohorts |
| Time to Second Purchase | How fast buyers return | 90 days | Median 15 to 35 days |
| 90-day and 12-month LTV | Profit or revenue per customer over time | 90 days, 12 months | At least 3:1 LTV:CAC |
| Cohort Retention Curves | How BFCM buyers fall off vs. other buyers | Monthly | BFCM cohorts often sit below non-BFCM |
| Churn after BFCM | Buyers who stop ordering | 90 days, 12 months | No universal benchmark |
New vs. Returning Customer Split
The new vs. returning customer split is the share of BFCM buyers who were buying from you for the first time versus those who had ordered before. It shows whether the sale grew your customer base or mostly discounted purchases existing customers would have made anyway.
When to track: Measure it at the end of the sale, by day, offer, and channel. Define “new” before launch (first order ever, not first order this year) so finance and CRM count the same way.
Benchmark: There’s no current universal figure, so use your own prior year. For context, Optimove’s analysis of 2021 data found 57% of Black Friday buyers were new, versus 54% on Cyber Monday. Existing customers spent more, at $113 versus $94 on Black Friday. The retention gap matters more than the split: six months later, 33% of existing customers had bought again, compared with 16% of new ones.
Repeat Purchase Rate (30, 60, 90 Days)
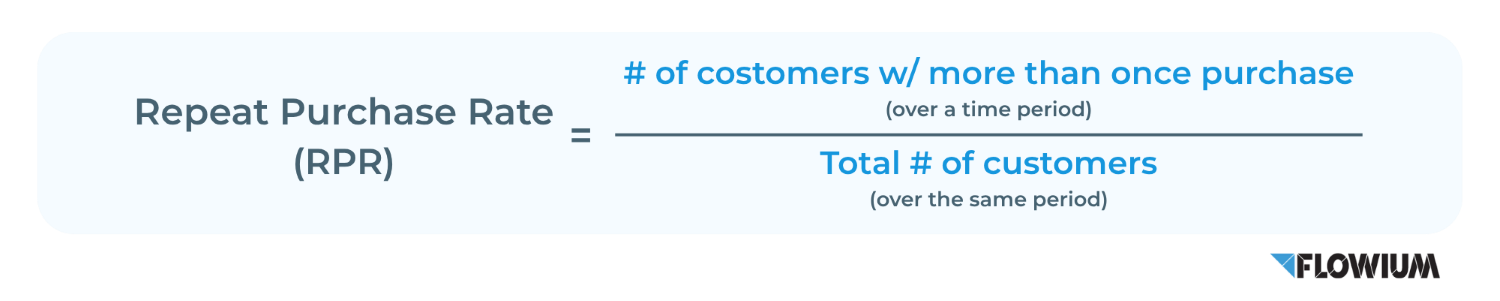
Repeat purchase rate is the share of customers in a BFCM cohort who have placed two or more orders within a set window, measured at 30, 60, and 90 days after the sale. Tracking it at three checkpoints shows how quickly the cohort comes back and where the drop-off starts.
When to track: Take a reading at 30, 60, and 90 days after each customer’s first BFCM order, and keep the window identical when you compare against a non-BFCM cohort. Most second orders land early: roughly half of repeat buyers reorder within 30 days and about three-quarters within 90. So the 30-day reading is a good early warning, and the 90-day reading captures most of the outcome. After 90 days, move customers who haven’t reordered into a win-back sequence.
Formula:
Benchmark: Published figures mostly use 6- or 12-month windows, so there is no clean public 30/60/90-day BFCM benchmark. These reference points can help:
- Blended average: about 28% over a long window. If roughly three-quarters of repeat orders arrive within 90 days, that implies a 90-day rate in the low 20s and a 30-day rate in the mid-teens.
- BFCM cohorts run lower: one analysis of 2024 cohorts found 13.95% of BFCM first- time buyers repeated within six months, compared with 19.2% for other customers.
- By vertical: one 90-day guide puts good rates at 30% to 45% for consumables, 20% to 32% for apparel, and under 18% for durables.
We recommend using your own non-BFCM cohort as the main comparison.
Time to Second Purchase
Time to second purchase is the median number of days between a customer’s first and second order. It tells you when to send follow-up messages and whether you’re reaching customers too late.
When to track: Calculate it for the BFCM cohort at 90 days, using the median rather than the average, since a few very late repeat orders can inflate the mean. Use it to set flow timing, such as triggering a reminder before the typical reorder point.
Benchmark: One 2026 analysis presented by Eightx puts the median across DTC ecommerce at 15 to 35 days. It runs about 15 to 27 days for apparel and beauty, 27 to 68 for supplements, and 30+ for electronics and home goods. The same source notes that dashboard averages can look like 50 to 100 days because of late outliers, which is another reason to use the median.
90-Day and 12-Month Customer Lifetime Value of BFCM Cohorts
Customer lifetime value (LTV) of a BFCM cohort is the cumulative profit, or revenue, that cohort generates after their first order. Compare it to what the cohort cost to acquire and to non-BFCM cohorts.
When to track: Review at 30, 60, 90, and 180 days, with a full read at 12 months. The 90-day figure is the key checkpoint for CAC payback.
Formula:

Benchmark: A common health check is an LTV:CAC ratio of 3:1 or higher. Shopify data found 64% of merchants say BFCM-acquired customers have lower LTV than those gained in non-promotional periods. There’s an upside to protect: Tresl.Segments conducted the cohort analysis and found BFCM buyers had a higher first-order value ($159 versus $120), so the value is there if the second purchase happens.
Cohort Retention Curves (BFCM Cohort vs. Non-BFCM Cohort)
A cohort retention curve plots the share of a customer group still buying in each month after their first order. Plotting the BFCM cohort next to a non-BFCM cohort shows whether sale buyers fall off faster or just reorder later.
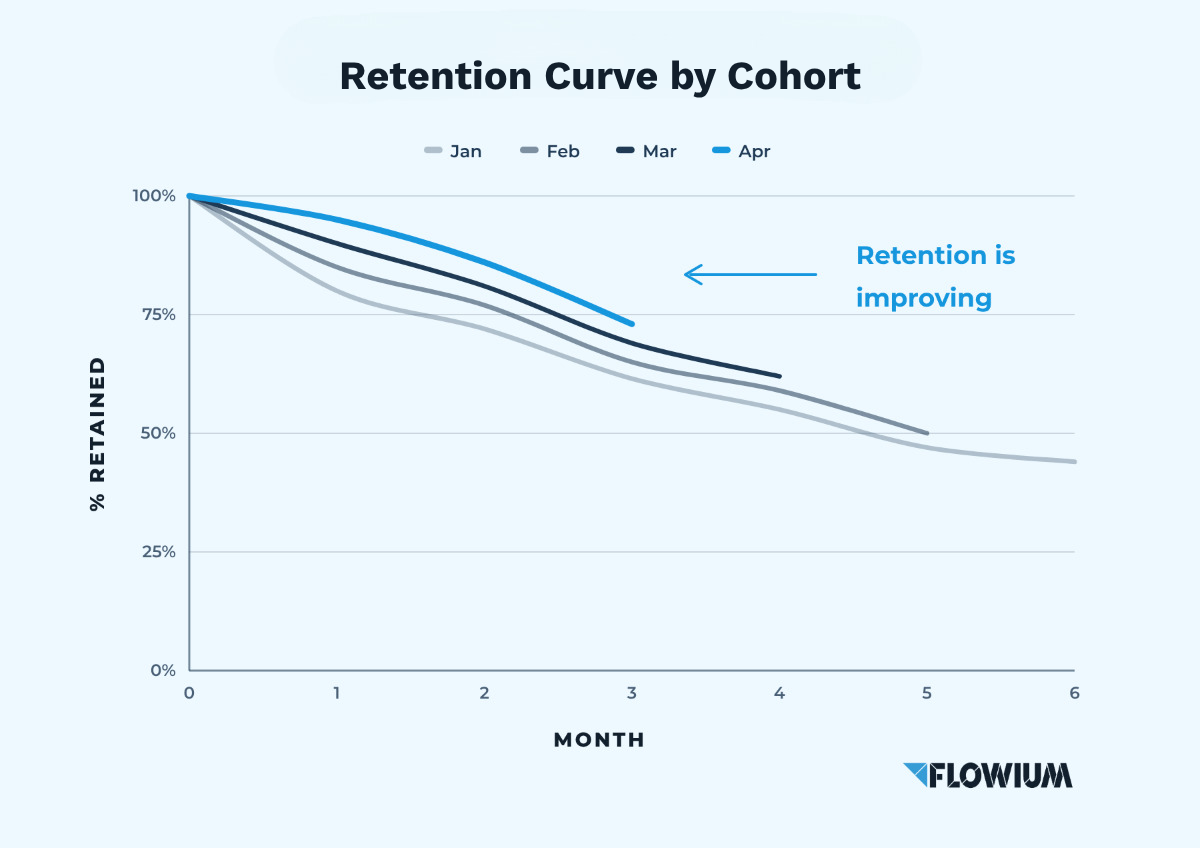
When to track: Update monthly for 12 months. Group customers by first-order date and tag the BFCM window, and where possible split by acquisition channel and offer, so you can see which sources produced customers who stayed.
Benchmark: Expect the BFCM curve to start lower. The 2024 gap (13.95% versus 19.2% six- month repeat) is a reasonable reference point. Many brands find the gap narrows when they run post-purchase flows built for BFCM buyers instead of reusing a standard welcome series. Judge success by closing the gap with your own non-BFCM curve.
Customer Churn After BFCM
Churn after BFCM is the share of BFCM customers who stop buying. For one-time purchase stores, it’s the inverse of repeat rate: the customers who never place a second order. For subscription brands, it’s the monthly cancellation rate of the BFCM cohort.
Formula:

When to track: For non-subscription stores, use 90 days as the checkpoint. One guide suggests treating a cohort as churned when no second order arrives in that window and moving it to a win-back sequence. For subscriptions, track monthly churn for at least six months, split by BFCM versus non-BFCM sign-ups.
Benchmark: There’s no reliable public BFCM- specific churn benchmark. For non- subscription stores, 1 minus the repeat rate is a workable proxy, which at a 28% repeat rate means roughly 70% of buyers do not return. Use your non-BFCM cohort as the baseline.
BFCM Lifecycle Marketing Metrics to Track After the Order
BFCM lifecycle marketing metrics measure how well your email and SMS programs turn first-time buyers into repeat customers once the sale ends. They cover the post-purchase flow, how the BFCM cohort engages, the revenue each message earns, and how many new subscribers the sale added. Track them from the moment the first BFCM order arrives, because most of the work happens in the first 30 to 90 days.
| Metric | What it tracks | When to check | Benchmark |
|---|---|---|---|
| Post-Purchase Flow Performance | Whether the flow drives second orders | Weekly for 90 days | Roughly 12% to 25% second purchase within 90 days |
| Email and SMS engagement for BFCM cohorts | Whether the cohort reads and clicks | Weekly through January | Flows far above campaigns; BFCM opens run low |
| Revenue per Recipient (RPR) | Revenue each message or flow earns | Weekly and at day 30, 60, 90 | Varies widely by AOV and source |
| Opt-in Rate and List Growth | New reachable subscribers from the sale | Before, during, and after BFCM | No standard; compare to your own baseline |
Post-Purchase Flow Performance
Post-purchase flow performance is how well the automated messages sent after a BFCM order produce a second purchase, reviews, and cross-sell revenue. Build the flow for BFCM buyers specifically, since a welcome series written for full-price customers misses their context.
When to track: Measure weekly for the first 90 days. Klaviyo’s default attribution window for flows is five days, so revenue from an email sent on day three can land in a later email’s results. Review results by flow email, not just the flow total.
Benchmark: Guides put the second purchase from a post-purchase flow at 12% to 25% of first-time buyers within 90 days, with 30%+ as an unusually strong result. Remember that BFCM cohorts tend to repurchase less than other customers, so compare to your own non-BFCM flow results first.
Email and SMS Engagement for BFCM Cohorts
Email and SMS engagement for BFCM cohorts is how the people acquired in the sale respond to your messages afterward. Track it for the BFCM cohort separately from the rest of your list.
When to track: Check weekly through January, split by new versus returning buyers and by email versus SMS. Put the most weight on click rate, conversion rate, and unsubscribe rate. Open rates are less reliable because Apple Mail Privacy Protection has inflated them since 2021. Post-purchase flows have the highest open rate of any flow (58%) yet one of the lowest revenue per recipient, which is why clicks and revenue matter more.
Benchmark: The consistent finding is that flows beat campaigns. Klaviyo-based averages put flow open rates near 48.6%, click rates near 4.7%, and conversion near 1.4%, well above campaign averages.
Revenue per Recipient from Post-BFCM Flows
Revenue per recipient (RPR) is the revenue attributed to a message or flow divided by the number of people who received it. It is the best single measure of whether a flow pays for itself, because it accounts for both conversion and order value.
Formula:

When to track: Review weekly during the flow’s first month, then at 60 and 90 days. Compare flows against each other, and compare the BFCM cohort’s RPR against non-BFCM recipients of the same flow.
Opt-in Rate and List Growth During BFCM
Opt-in rate is the share of site visitors who join your email or SMS list, and list growth is the net number of new reachable subscribers the sale adds. It determines how many of the BFCM buyers and browsers you can still contact in January.
Formula:

When to track: Measure opt-in rate by day before, during, and after BFCM, along with net list growth after unsubscribes. Track it by source (popup, checkout, post-purchase, package insert) to find where subscribers came from. Also count how many new BFCM buyers are reachable by email, by SMS, or by both.
Benchmark: There’s no reliable universal opt-in rate, so use your own baseline. For context on the lift in peak periods, Postscript reported merchants adding over 500,000 first-time SMS subscribers across BFCM 2024, with Black Friday opt-ins up 61% year over year.
How to Measure BFCM as a Customer Acquisition Event
To measure BFCM as a customer acquisition event, tag first-time buyers in the sale window as a cohort, calculate what they cost to acquire, and compare that to the profit they generate over 90 days and 12 months.
Calculating the True Value of a BFCM Customer (LTV:CAC Ratio by Cohort)
LTV:CAC compares the gross profit a BFCM customer generates with what it cost to acquire them. Calculate it by cohort, since a store-wide ratio can hide channels that lose money.
- Define the cohort. Include only customers whose first-ever order fell in the BFCM window, and tag them at purchase.
- Calculate new-customer CAC. Acquisition spend attributed to BFCM ÷ new customers acquired. Don’t add discounts here if you’ve already subtracted them in gross margin.
- Calculate margin-adjusted LTV. Cumulative gross profit per customer after discounts and returns, measured at 90 days and 12 months.
- Divide and split. LTV ÷ CAC, by offer, channel, and discount depth, compared with a non- BFCM cohort.
- Check payback. CAC ÷ gross profit per customer per period. A ratio shows how much value may arrive; payback shows when you recover the cost.

When to measure: Day 30, 90, 180, and 12 months. The 90-day read is the main decision point for next year’s spend.
Benchmark: About 3:1 is the commonly cited healthy ratio for ecommerce, though it varies by vertical (one source puts apparel near 2.1:1 and supplements near 4.8:1). Many investors want CAC recovered in under 12 months. Expect BFCM cohorts to run lower than non-BFCM cohorts.
How to read it:
- At or above benchmark, fast payback: scale the channels and offers that produced the cohort.
- Low ratio, first order covers CAC: the cohort pays for itself, so focus on lifting the second purchase.
- Low ratio, slow payback: cut discount depth or shift spend to higher-LTV channels.
What to Do With Your BFCM Metrics: Turning Data into Retention
Now that you know which metrics to track, here’s how to turn them into action:
- Create a post-BFCM customer segmentation plan. Use your reviews and loyalty data to segment customers into groups: highly engaged, moderately engaged, and at-risk. Tailor your retention efforts to each segment with personalized messaging and offers.
- Launch a strategic review generation campaign. Your best customers are your best marketers. Use insights from high-rated products to encourage more reviews and user-generated content that you can leverage throughout the year.
- Optimize your email and SMS flows based on behavior data. If certain messages or offers drive higher engagement or conversion, make them more prominent. If customers aren’t responding, test new approaches and creative strategies.
- Address product and service gaps immediately. Don’t let negative reviews or low satisfaction scores linger. Fix the issues, communicate the improvements to affected customers, and turn detractors into advocates.
- Build a year-round calendar around your winners. Your top-performing BFCM products and campaigns should inform your entire 2026 strategy. Lean into what worked and iterate on what didn’t.
How Flowium Implements Post-BFCM Metrics Analysis Into Retention Strategies
Flowium used post-BFCM performance analysis for one of our clients, a DTC jewelry brand, to evaluate whether holiday sales translated into long-term customer value. Rather than focusing solely on campaign revenue and order volume, the analysis tracked customer cohorts, repeat-purchase behavior, and revenue generated after the promotional period.
Our DTC jewelry brand case study illustrated this approach:
- New customer acquisition and cohort performance
Flowium compared first-time BFCM customer cohorts year over year to understand whether increased acquisition translated into more returning customers.
- New customers acquired: 77,250 (+21% YoY).
- Customers who placed a second order within six months: 11,446 (+17% YoY).
- Six-month repeat-purchase rate: 17.2% for November buyers and 13.3% for December buyers.
- Repeat-purchase revenue and retention performance
The analysis extended beyond BFCM to measure how much revenue acquired customers generated over the following months.
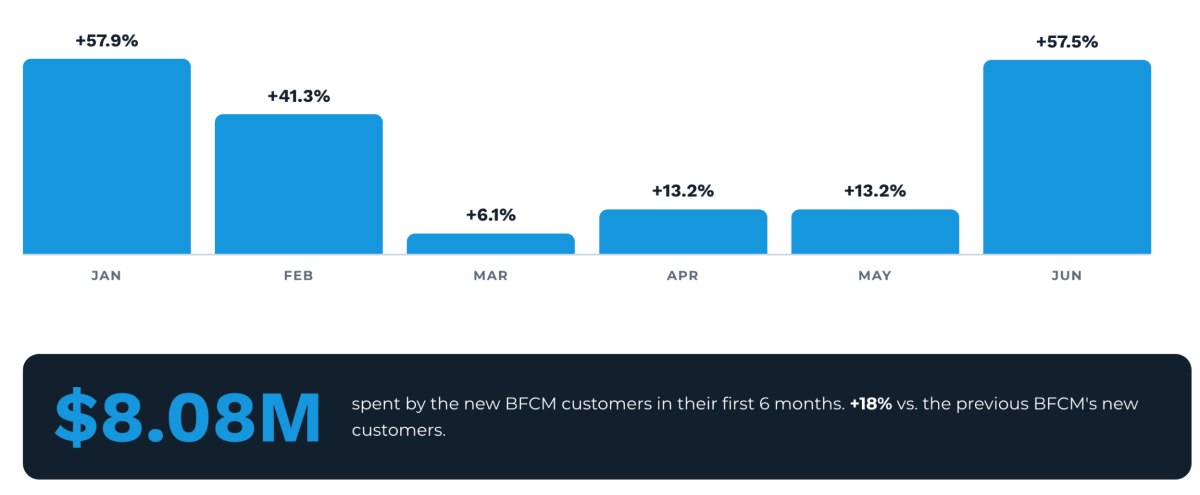
- Repeat orders increased by 43% during December-May compared with the previous year.
- Repeat-customer revenue reached $4.90M, up from $3.32M.
- Monthly repeat-customer revenue from January through June increased by 28.6% overall year over year.
3. Translating metrics into retention strategies
Based on these findings, our team developed retention strategies around the customer behaviors revealed by the data:
- Post-purchase engagement. Proactive order updates and thank-you sequences maintained customer trust after checkout.
- Second-purchase activation. Targeted bounce-back offers encouraged first-time BFCM buyers to make another purchase.
- Customer segmentation. Separate journeys addressed new and existing customers instead of applying the same messaging to both groups.
- Extended campaign planning. Lifecycle campaigns continued beyond Cyber Monday, using seasonal occasions and personalized recommendations to generate repeat purchases.
This approach connected BFCM metrics with measurable retention outcomes, helping the brand evaluate not just how much revenue its holiday campaign generated, but how effectively it converted seasonal buyers into repeat customers.
Common BFCM Measurement Mistakes
According to a Flowium retention marketing specialist, Candelaria Trucco, one of the most common mistakes ecommerce brands make during BFCM is focusing too heavily on immediate revenue while overlooking the long-term value of the customers they acquire.
“I often see brands evaluate BFCM performance almost exclusively through total revenue, ROAS, and conversion rates. These metrics are important, but they don’t show whether the campaign attracted customers who will actually contribute to future growth.
Another mistake is failing to separate new and returning customers when analyzing results. Repeat customers can account for a significant share of BFCM revenue, so combining both groups can make acquisition performance look stronger than it really is.
Brands also tend to stop measuring performance once the BFCM sales period ends. However, the real value of seasonal acquisition becomes clearer over the following 30, 60, and 90 days. Without tracking second-purchase rates, cohort retention, and customer lifetime value, you can’t determine whether your BFCM campaigns generated lasting growth or just a temporary revenue spike.
My recommendation is to evaluate BFCM performance across two dimensions: immediate campaign results and post-purchase customer behavior. This gives you a much clearer picture of whether your holiday strategy is building a stronger customer base or simply driving short-term sales.”
Build Your Post-BFCM Retention Strategy With Flowium
As we have seen throughout this article, performing a post-BFCM analysis will be very beneficial. The BFCM customer retention process does not end with loyalty programs or personalized communication. Long-term success lies in continually surprising and delighting your audience. Exclusive first impressions of products, invitations to brand events, and recognition on community forums can build loyalty. Everything adds up.
Ensure your brand stays relevant and valuable beyond seasonal sales peaks. Your ability to consistently deliver exceptional experiences lays the foundation for a thriving, loyal customer base year-round. Turn to Flowium to optimize your strategy.
At Flowium, we help ecommerce brands turn customer data and lifecycle insights into retention strategies that drive measurable results. Contact us to start building a post-BFCM strategy that makes your holiday sales count long after the shopping season ends.
Frequently Asked Questions
What metrics should I look at after BFCM?
Four carry most of the signal: the share of BFCM revenue that came from new customers, discount depth measured against contribution margin per order, the repeat purchase rate of your BFCM cohort at 30, 60, and 90 days, and the returns rate once returns have fully landed. Each one maps to a concrete decision about next year, which is the test of whether a metric belongs in the readout.
How long does it take for BFCM returns to show up?
Returns typically arrive through December and into January, especially for gifted products, so a returns rate read in the first week after the sale is incomplete and will understate the final number. Log the metric as a placeholder in your readout, then fill it in at your 30- and 60-day check-ins. Read it by product: an outlier usually points to a sizing issue or a PDP that oversells.
When should I judge whether BFCM buyers came back?
Check the cohort at 30, 60, and 90 days after the sale, and compare against your September and October cohorts at the same age rather than against industry benchmarks. Respect your product cycle: a consumable brand can judge at 60 days, while a durable-goods brand may need six months or more before a low repeat rate means anything.