Your team is deciding whether to increase campaign spend or invest in another marketing channel, such as email marketing. Attributed revenue alone cannot show how many purchases a campaign caused. Measuring incrementality in marketing helps ecommerce teams estimate the additional orders and net revenue a campaign or channel generates.
Some customers would have bought through another channel or returned to buy on their own. The campaign may still receive credit for the order. Compare the same marketing mix with and without the campaign before increasing spend. Below, you’ll learn how to measure incremental revenue from campaigns and channels and decide whether the additional sales justify the cost.
What Is Incrementality in Marketing?
Incrementality in marketing is the change a marketing activity causes in customer purchases compared with what would happen without it. For an ecommerce store, the effect can appear in order volume, net revenue, or repeat purchases.
Suppose a shopper clicks a retargeting ad and reorders a product. The store records the purchase, but the customer may have planned to return anyway. The store cannot observe both outcomes for the same customer under the same conditions: the purchase after seeing the ad and the purchase decision without it.
Evaluating the campaign requires an estimate of the missing outcome. The counterfactual describes what customers would have done without the ads; an estimated baseline gives the store a reference for measuring the difference. Incremental revenue and relative lift express the size of the effect. An incrementality test provides evidence for judging whether the ads caused the change before the team uses the results to adjust its budget.
Baseline and Counterfactual
The counterfactual is what the same customers would have purchased if the activity being evaluated had not taken place. A control group provides data for estimating the baseline: expected purchases without the tested campaign.
The baseline is dependent on the question. It can also be used in a retargeting campaign, along with the store’s standard retention program. Evaluating one campaign does not mean comparing all marketing with no marketing.
Incremental Revenue
Incremental revenue is the revenue that a campaign or channel brings in beyond the baseline. Discounts and returns are included in incremental net revenue.
Revenue gains do not equal profit. The revenue gain is still used for product, fulfillment and other marketing costs.
Incremental Lift
Relative incremental lift is the estimated change as a percentage of the baseline. Revenue lift is the revenue change, and conversion lift is the change in purchase rate.
Conversion lift and revenue lift do not have to go hand in hand, as a promotion can draw in more buyers and reduce the average order value.
Incrementality Testing
An incrementality test uses a planned comparison to estimate a marketing activity’s causal effect. Customer-level tests are used to compare assigned groups, while geo tests are used to compare markets.
A test can show a positive effect, a negative effect, or no effect (when the evidence does not allow for a clear conclusion). An inconclusive result does not mean that the activity had no effect.
Attribution vs. Incrementality: What Each Tells You
A shopper discovers a brand through a social ad and later returns through search to buy. Attribution assigns conversion credit according to the chosen model. Last-touch attribution credits the final qualifying interaction. A controlled test compares outcomes with and without a specific campaign to estimate its effect on sales.
Ecommerce teams review attribution in advertising platforms such as Google Ads, email and SMS platforms such as Klaviyo, and analytics tools such as Google Analytics. Each tool assigns conversion credit using the interactions it records and its attribution settings.
| Dimension | Attribution | Incrementality |
|---|---|---|
| Main question | Which observed touchpoints receive conversion credit? | What additional outcome did the tested activity cause? |
| Basis | Observed interactions and the model’s attribution rules | Outcomes under a defined treatment and comparison condition |
| Baseline purchases | Can receive marketing credit under the chosen rules | Form part of the estimated outcome without the tested activity |
| Practical use | Campaign monitoring and customer-journey analysis | Decisions about adding, removing, or changing an activity |
| Main limitation | Conversion credit alone does not establish causality | Findings depend on test design, uncertainty, audience, and timing |
Attributed revenue can include orders a campaign did not cause. For example, a customer who already plans to reorder might use an SMS link to reach the store. Klaviyo can credit the message when the purchase meets its attribution rules, but the click does not prove that SMS generated an additional purchase.
Attribution can also miss sales a campaign helped generate. A customer might buy after the attribution window closes, or another channel might receive the credit. Attributed revenue can be higher or lower than the campaign’s incremental revenue. Campaign reports help monitor performance; a controlled test estimates how much the activity adds to sales.
Platform reports can overlap, too. If Meta and Google both claim the same order, adding their reported revenue counts one purchase twice. Check platform totals against store orders before reporting overall performance. Counting an order once still does not establish whether marketing caused the purchase.
How to Measure Marketing Incrementality
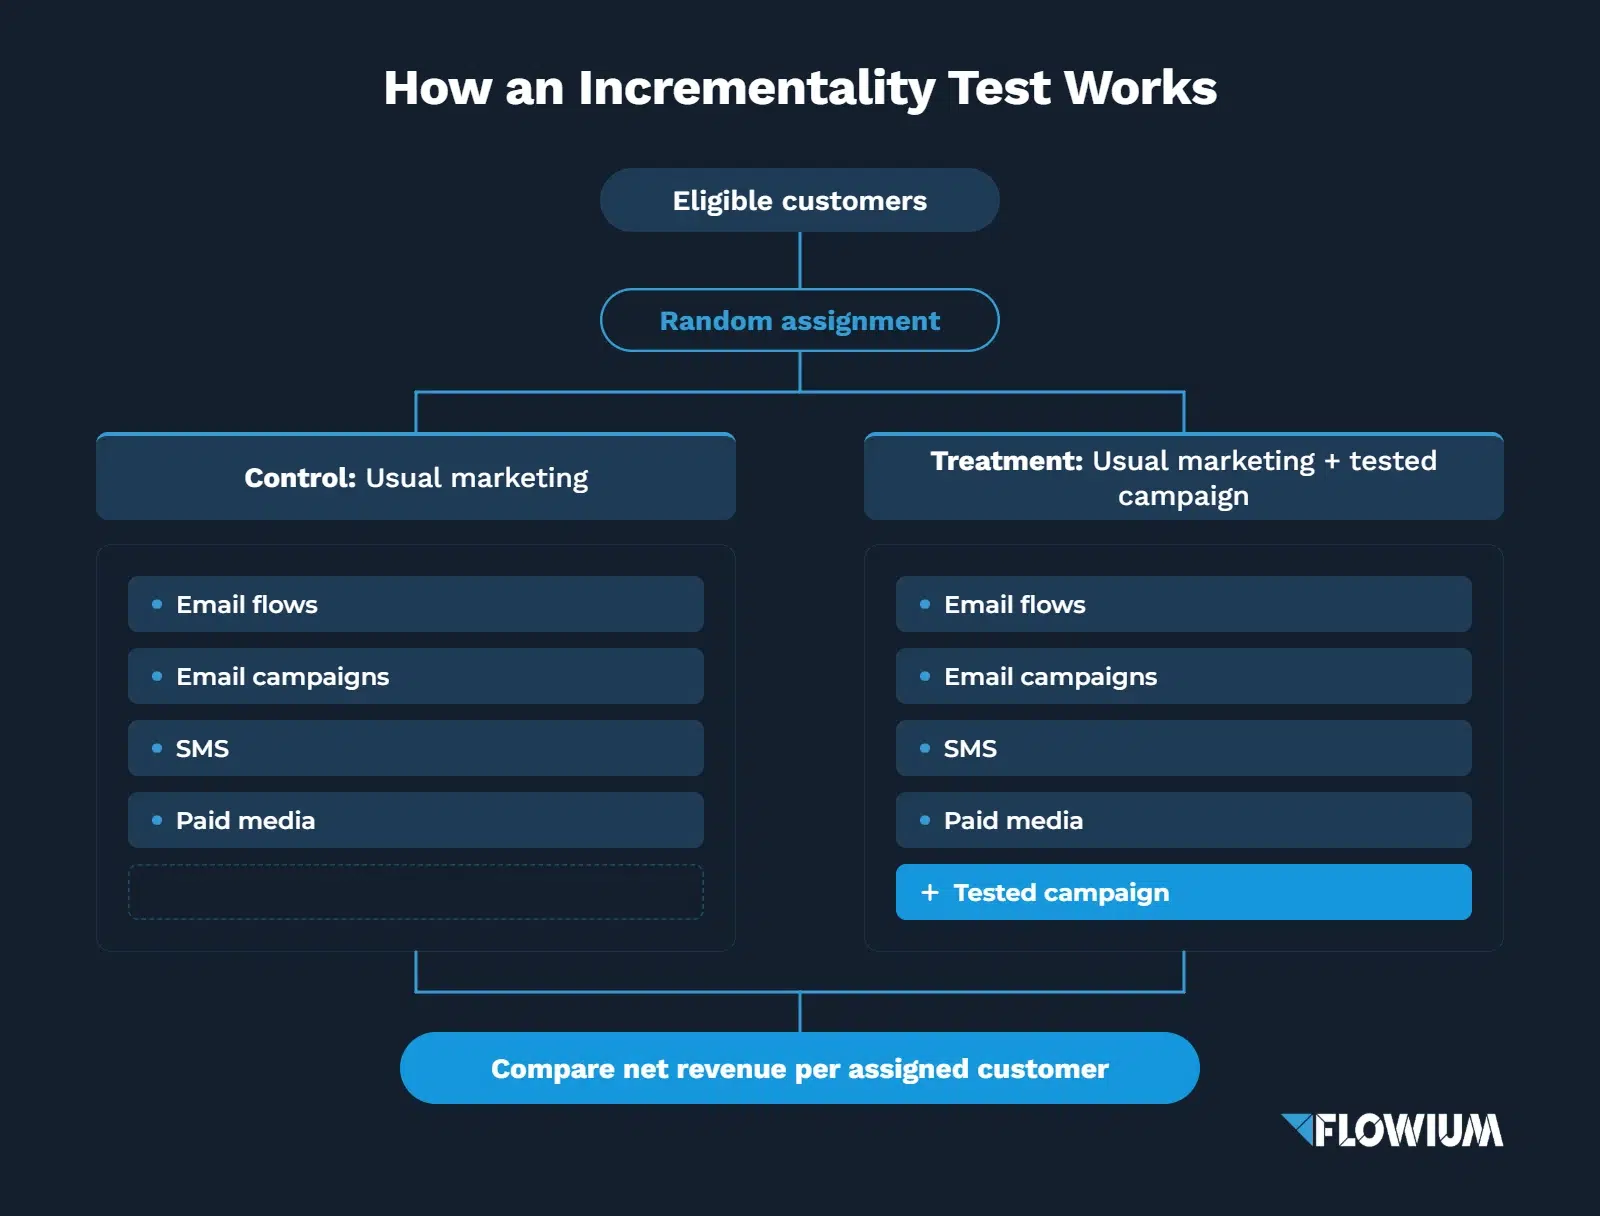
A holdout for a multichannel marketing program excludes the control group from the campaigns and channels under evaluation. A campaign holdout excludes only the selected campaign. When testing an added message, both groups follow the existing sequence, but only the treatment group receives the extra message.
Define the Test Question
Start with one question: does adding an SMS to the existing email flow increase net revenue per eligible customer? Record the added message and the email-only baseline.
Decide how the findings could change the plan. You might keep the message, revise the offer or sending frequency, or run a further test before expanding.
Choose a Test Design
Two common experiment designs compare individual customers or geographic markets. The choice depends on how you can control who receives the marketing activity.
- Customer-level randomized holdout: compare groups of customers. Randomly assign eligible customers to two groups. One receives the tested campaign; the control group does not. Other usual marketing continues in both groups. For example, flow branches in Klaviyo can create random customer groups for a message test. Creating the paths handles delivery; you still need to compare purchases across all assigned customers.
- Geo-lift: compare groups of regions. Run the tested activity in selected markets and withhold it from control markets. A retailer could use this approach to evaluate paid search when individual customer assignment is impractical. The regions need comparable sales trends before the test and an analysis that accounts for market differences. Google Ads Conversion Lift supports geographic studies for eligible accounts.
A subject-line A/B test answers which message version performs better. Comparing a message with no message addresses a different question: whether sending it adds sales.
Marketing mix modeling (MMM) uses historical sales and marketing data to estimate channel contributions. It is a modeling approach rather than an experiment. Results from incrementality tests can help calibrate its estimates.
Randomize Eligible Customers Into Stable Groups
Set the eligibility and assignment rules before the first customer enters the test.
- Define the eligible audience. Apply the same eligibility criteria to both groups. For example, an email-only versus email + SMS test requires customers who meet the eligibility and consent requirements for both channels.
- Keep entry rules consistent. For flow tests, use the same qualifying event and purchase exclusions in both groups.
- Assign customers once. Randomly assign customers before the tested activity begins and keep each person in the same group throughout the experiment. Honor consent changes without moving customers between groups.
- Account for purchase history when needed. If purchase history matters, randomize within predefined groups, such as first-time and repeat buyers. Avoid creating so many segments that each comparison has too few purchases.
- Keep assignments independent of engagement. Do not build the control group from people who did not open or click.
Set the Outcome, Sample Size, and Measurement Window
Set the measurement rules before launch, so both groups have the same basis for comparison.
- Choose one primary outcome. Tie the metric to your test question, such as net revenue per assigned customer.
- Define the revenue calculation. Apply the same rules for discounts, refunds, tax, and shipping in both groups. Do not subtract a discount again if the revenue metric already includes it.
For Shopify stores: Klaviyo’s Placed Order value includes shipping, taxes, and tips but does not subtract refunds or cancellations. Use store order and refund data to calculate net revenue. - Calculate the required sample size. Use historical customer-level data to estimate baseline revenue and its variability, including the influence of unusually large orders. Specify the smallest lift worth detecting, statistical power, and error thresholds as part of the calculation.
- Set enrollment and purchase-observation windows. Define when customers can enter the test and how long you will track purchases after assignment. For flows with rolling entry, give customers comparable follow-up periods.
- Choose the holdout share and test duration. Base both on the required sample and the relevant purchase cycle. If enrollment ends before the last customers complete their observation window, wait for their follow-up before the final analysis.
Keep the Comparison Consistent
Keep shared content, offers, scheduling, and purchase-exclusion rules the same across groups. The tested activity should be the only planned difference. Check whether another campaign or flow could accidentally expose control customers to the activity you are withholding. Review frequency limits and suppression rules that could cause the added activity to reduce delivery of other campaigns. Any resulting skips become part of the change you are testing.
Other channels can continue under the same usual rules for both groups. Keep order confirmations and other necessary transactional messages active. Record major promotions, stock shortages, and tracking changes alongside the test dates.
Compare Outcomes Across All Assigned Customers
Use store order data to compare the original test groups.
- Include every assigned customer. Count purchases through direct traffic and other channels. Keep customers with no purchases in the denominator. Restricting the analysis to clickers or attributed orders changes the audience after assignment.
- Check the order data. Link store orders to customer assignments in both groups. Check for duplicate orders or missing customer identifiers before interpreting the difference.
- Compare revenue per assigned customer. Account for unequal group sizes, and report the estimated difference with an uncertainty interval.
- Follow the analysis plan and stopping rule. Ending a test at the first favorable reading outside the agreed plan can produce a misleading answer.
An inconclusive result does not prove that the message had no effect.
How to Calculate Incremental Revenue
Incremental revenue is the revenue a campaign or channel adds beyond what customers would have spent anyway. Customer-level experiments estimate the baseline from control-group purchases, geo tests use comparison markets, and MMM models revenue with and without the activity.
For example, a customer-level test randomly assigns customers to receive the campaign (treatment group) or continue without it (control group). If the groups differ in size, compare net revenue per assigned customer before estimating total incremental revenue. A larger group should not look more effective simply because it contains more customers.
Incremental Revenue Formula
The treatment group’s net revenue includes purchases customers would have made anyway. To estimate incremental revenue, subtract the net revenue expected from the same number of customers without the tested campaign:
Estimated incremental revenue = Actual net revenue with SMS − Expected net revenue without SMS
The expected amount comes from the email-only control group. Because the groups contain different numbers of customers, you need to adjust the baseline before subtracting:
- Calculate net revenue per customer in the email-only group. Divide the group’s net revenue by its assigned customer count, including customers who did not buy.
- Estimate the baseline for the larger SMS group. Multiply the email-only revenue per customer by the number of customers assigned to email + SMS. The result estimates how much revenue the SMS group would have generated without the text.
- Subtract the baseline from the SMS group’s actual net revenue. The difference is your estimated incremental revenue.
Use the same net revenue rules and measurement period for both groups. This calculation applies to a randomized customer-level test.
Incremental Revenue Example
Suppose an ecommerce store wants to add an SMS reminder to its cart-recovery email flow. Before expanding SMS, the retention team wants to know how much additional revenue the extra message generates.
In this hypothetical test, the team randomly assigns 10,000 eligible customers with consent for both channels: 8,000 receive the existing email flow plus an SMS, and 2,000 receive the same emails without the text. Other marketing continues under the same rules in both groups. The team tracks all net revenue over the same follow-up period.
| Metric | Email + SMS | Email only |
|---|---|---|
| Assigned customers | 8,000 | 2,000 |
| Total net revenue during the measurement period | $96,000 | $20,000 |
| Net revenue per assigned customer | $12 | $10 |
Use the email-only group’s $10 per customer as the baseline for estimating revenue without the added SMS:
- Expected treatment-group revenue: $10 × 8,000 = $80,000.
- Estimated incremental revenue: $96,000 − $80,000 = $16,000.
- Relative revenue lift: ($12 − $10) ÷ $10 × 100 = 20%.
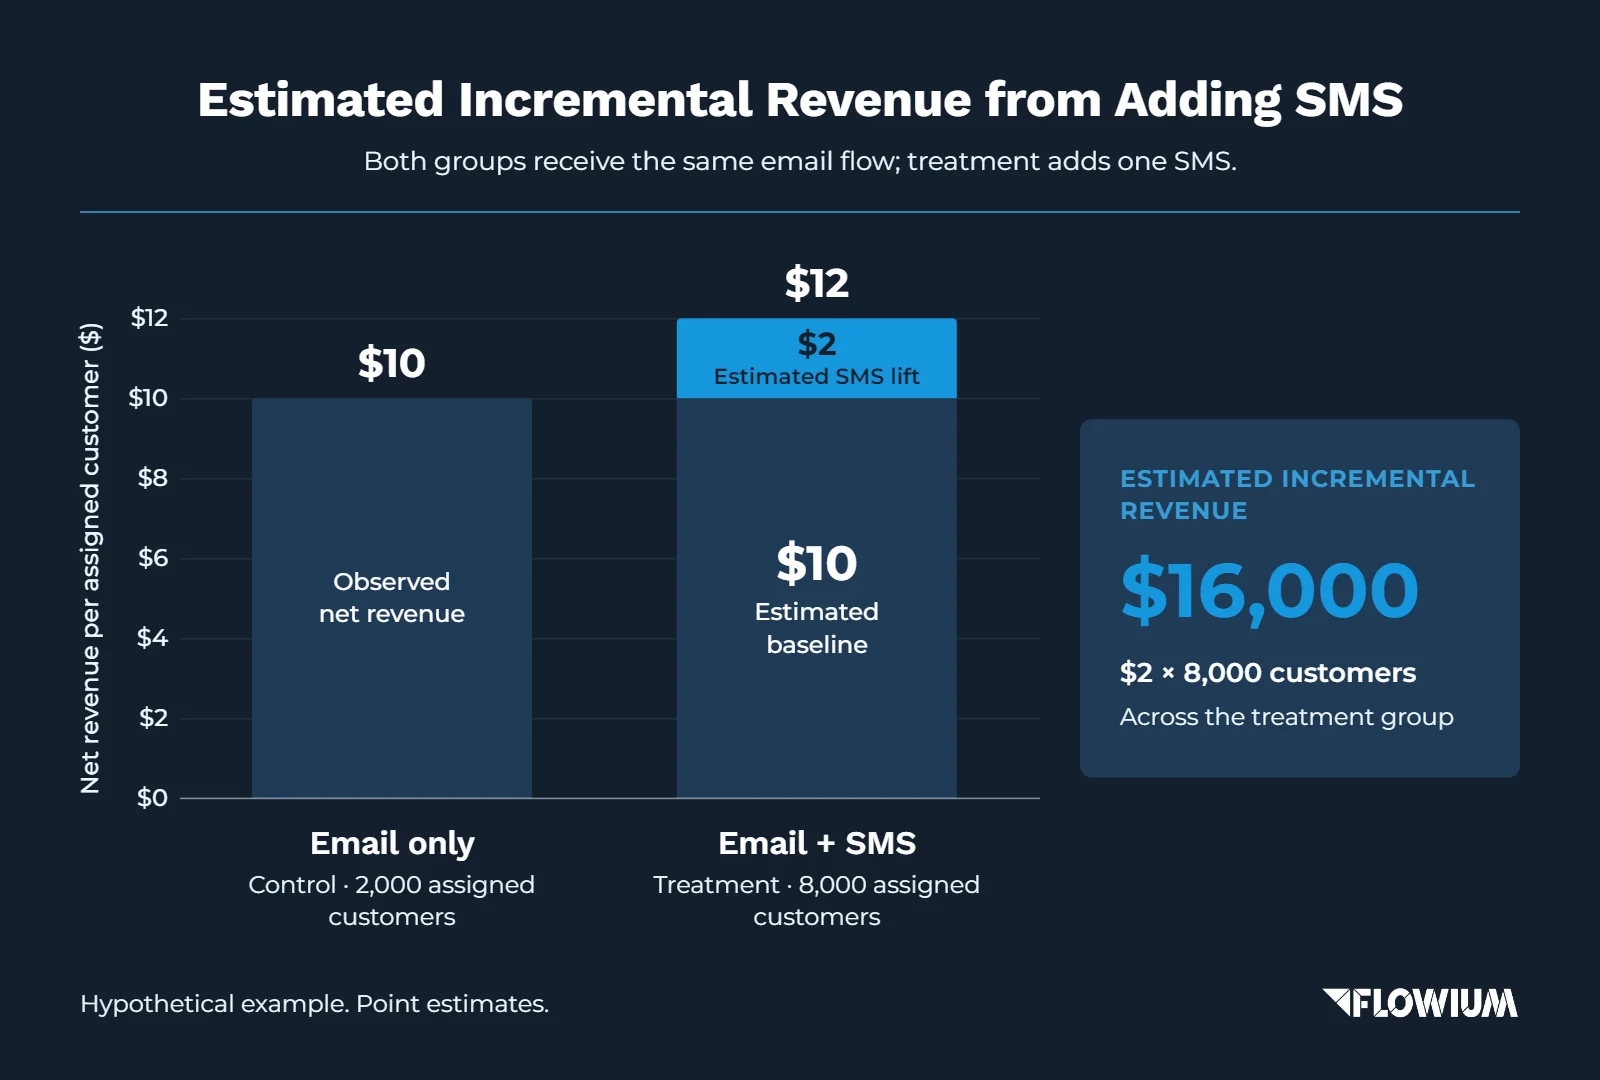
The $96,000 includes all treatment-group net revenue during the measurement period, regardless of which channel receives attribution credit.
The $16,000 is a point estimate for the 8,000 treatment customers. Report uncertainty separately to show how precisely the test estimates the SMS effect.
Check contribution margin and additional messaging costs before deciding whether the extra sales improve profit. Product and fulfillment costs still have to be paid out of the extra net revenue.
For paid advertising, incremental return on ad spend (iROAS) measures the additional revenue generated per dollar of advertising spend. When comparing a campaign with no campaign:
iROAS = Estimated incremental revenue ÷ Ad spend for the tested campaign
A budget-increase test uses the additional spend above the baseline. For email and SMS, state which costs you include in your return calculation, such as sending fees and additional production work.
Incremental Revenue From Geo Tests
Geo tests estimate how much revenue the treatment markets would have generated without the tested campaign. A common approach uses pre-test sales patterns and control-market results to predict baseline revenue.
Estimated incremental revenue = Actual test-market net revenue − Predicted baseline net revenue
The baseline applies to the treatment markets over the measurement period. Simply subtracting one region’s revenue from another can mistake differences in market size or normal sales levels for campaign impact. Report uncertainty around the estimate.
Incremental Revenue From Marketing Mix Modeling
When MMM uses net revenue as the outcome, it compares two modeled scenarios for the same period. One uses the channel’s recorded activity. The other sets the channel to a defined baseline, such as zero spend, while keeping other modeled conditions unchanged.
Estimated incremental revenue = Modeled net revenue with the activity − Modeled net revenue at baseline
Both figures come from the model. The estimate depends on the model’s assumptions and data quality, rather than a direct comparison between randomized customer groups.
How to Test Email and SMS Incrementality
Adding an SMS and a discount at the same time tests the combined change. To measure what the extra message adds, keep the offer consistent and vary whether customers receive the SMS.
| Business question | Control | Treatment | What the comparison estimates |
|---|---|---|---|
| Does this email campaign add sales? | Usual marketing without the selected campaign | Usual marketing plus the selected campaign | Incremental effect of that campaign |
| Does SMS add value alongside email? | Email only | The same email program plus SMS | Additional effect of SMS given email |
| Does one more flow message help? | Existing flow | The same flow plus one message | Effect of the extra message |
| Does the incentive improve the result? | Message without the tested incentive | Otherwise comparable message with the incentive | Effect of the offer on the chosen outcome |
To measure SMS incrementality alongside email, form both groups from customers eligible for email and SMS. Comparing the full email list with the SMS list mixes audiences. An incentive test estimates the offer’s effect within the existing channel setup; email incrementality requires a comparison without the tested email activity. For incentive tests, also compare contribution per assigned customer after product, fulfillment, and additional marketing costs.
For example, a store using Klaviyo can test an extra SMS with a random flow split: one path keeps the existing email sequence, and the other adds the text. The split creates the delivery paths. The team still needs to keep customer assignments stable and compare net revenue per assigned customer, including customers who never buy.
To evaluate the wider messaging program, Klaviyo’s global holdout withholds marketing email, SMS, and push messages, except transactional flow messages and any campaigns or flows you override. The feature requires at least 400,000 total profiles. Because the holdout spans channels, its results do not isolate the added SMS.
Flowium Case: A Holdout Test for True Classic
True Classic wanted to reach website visitors who left without subscribing. We partnered with Opensend to identify visitors and bring their contact data into Klaviyo, then rebuilt the email flows used to follow up.

The team assessed Opensend’s contribution through a 95/5 split between active and holdout groups. The active group received email follow-ups, while the holdout provided a baseline for purchases without the tested outreach. The comparison helped separate the added activity’s contribution from purchases customers would have made anyway.
Opensend reports that the emailed group outperformed the holdout. The published case reports $21,800 in new revenue within the first seven days.
How to Use Incrementality Results to Make Marketing Decisions
Before expanding an SMS flow, read the estimated lift alongside its uncertainty interval. Check whether the extra revenue leaves enough contribution after product, fulfillment, and additional marketing costs.
- Convincing positive lift with acceptable contribution. Keep the activity for the tested audience at the tested frequency. Evaluate the next expansion separately, such as adding SMS to another lifecycle flow.
- Positive revenue lift with weak economics. Revisit the incentive, audience, or cost per send. Extra orders from a discount may leave too little margin to justify the messages.
- Inconclusive result. Check whether the interval still allows for a useful gain or a meaningful loss. Assess whether a follow-up test can collect enough data to narrow it. Report the uncertainty; the test has not established zero effect.
- Convincing negative lift. Check group assignments, delivery, and order tracking for implementation errors. If the comparison is sound, consider reducing the frequency or changing the activity.
Lift at the current frequency does not predict what doubling sends will do. Test the higher frequency separately. Results from holiday shoppers or a particular segment also need validation before you apply them across the customer base.
Measure Your Email and SMS Impact With Flowium
Bring your current email and SMS reports and a decision your team needs to make: whether to add a cart-recovery text, adjust flow frequency, or change an incentive.
Our free email marketing audit covers email strategy, campaign performance, automated flows, and analytics. We’ll assess your current email setup and recommend changes to its flows and reporting before you commit more budget to expansion.
Conclusion
Start with one marketing decision, such as whether to increase campaign spend or add a channel. Define the comparison before testing, then assess the estimated lift and its uncertainty. Check whether the additional sales leave enough margin to justify the costs. Keep attribution for routine campaign monitoring and use incrementality results to guide budget and channel decisions.
If you’re considering more SMS sends, schedule a consultation with Flowium, and we’ll help you review overlapping email and SMS reminders, flow frequency, and incentive costs before you expand the program.
Frequently Asked Questions
What is a good incrementality lift for ecommerce?
There’s no universal percentage to aim for. Evaluate the outcome you measured, the uncertainty around the estimate, and the contribution after costs. A large relative lift from a small control baseline can still mean little extra revenue.
Can small ecommerce stores run meaningful incrementality tests?
Yes, if you can collect enough data for the effect you need to detect. Purchase frequency and outcome variability matter alongside eligible audience size. A native feature’s eligibility limits govern access to the tool. You can still design a separate randomized holdout if you can maintain assignments and measure outcomes.
Can I run an incrementality test during Black Friday?
A Black Friday test can answer a peak-season question. Allow enough staff time to check the setup, keep shared promotions consistent across groups, and preserve assignments throughout follow-up. Check the result outside the holiday period before using it to set your usual sending frequency or budget.
How can I tell whether a campaign only brought purchases forward?
Plan a longer follow-up period before launch. Compare cumulative orders or net revenue per assigned customer across both groups, including purchases after the offer ends. If the early gap narrows as control customers buy later, some of the initial lift may reflect a change in purchase timing.
Can I add incremental revenue from separate channel tests together?
Not automatically. Channels can reinforce or substitute for one another, and each estimate depends on its baseline. Email-only versus email + SMS measures what SMS adds when email already runs. Adding estimates from different control conditions can misstate the program’s combined contribution. For a program total, test the combined activities against an appropriate holdout.