Running an ecommerce business means dividing attention between multiple priorities—from marketing and sales to customer support and operations. However, without a clear understanding of your key performance indicators (KPIs), it becomes much harder to make the right strategic decisions.
Often, brands make the mistake of focusing solely on revenue, overlooking the ecommerce metrics that actually determine profitability.
That’s where ecommerce profitability benchmarks come into the picture. They provide a clear framework for evaluating performance, identifying gaps, and understanding what success looks like in your industry.
In this guide, we’ll break down the most important ecommerce profitability benchmarks.
Why Ecommerce Profitability Benchmarks Matter
Every ecommerce company produces data, but not all of them know how to analyze it and use it effectively. Without the right context, metrics alone don’t tell you whether you’re actually performing well.
Benchmarks act as a reference point, helping you evaluate both operational and financial performance against industry standards.
They also give meaning to key metrics like conversion rate or cart abandonment. Without knowing benchmarks, these numbers can be misleading, making it difficult to understand whether your business is on track or falling behind.
By tracking the right benchmarks, you can compare your progress to industry trends. This allows you to adjust your strategy quickly and stay aligned with your ecommerce profitability goals.
Ecommerce Profitability Benchmarks Help You:
- Understand if your performance is above or below industry standards
- Identify weak points in your funnel or operations
- Make data-driven decisions instead of relying on guesswork
- Align your strategy with profitability goals
Key Ecommerce Profitability Benchmarks to Monitor in 2026
Gross Profit Margin
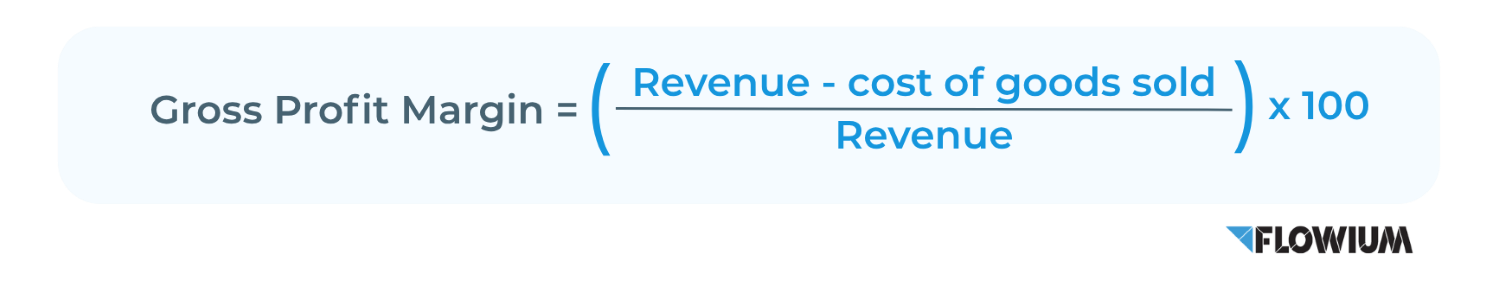
Gross profit margin is the amount of revenue left after subtracting the cost of goods sold (COGS). It determines how much money is available to pay for operating costs (marketing, labor, rent, and software) while still making a profit.
When your gross margins are low, you are compelled to work on narrow margins with limited room for error. Higher margins give you more room to experiment, invest in growth, and withstand market fluctuations.
How to calculate:
Example:
An ecommerce company that sells outdoor furniture, for example, makes $20,000 a month with $5,000 in COGS.
The gross profit margin = (20,000 – 5,000) ÷ 20,000 * 100 = 75%.
General Benchmark:
Most ecommerce businesses need a gross margin of atleast 50% to achieve sustainable profitability.
Net Profit Margin
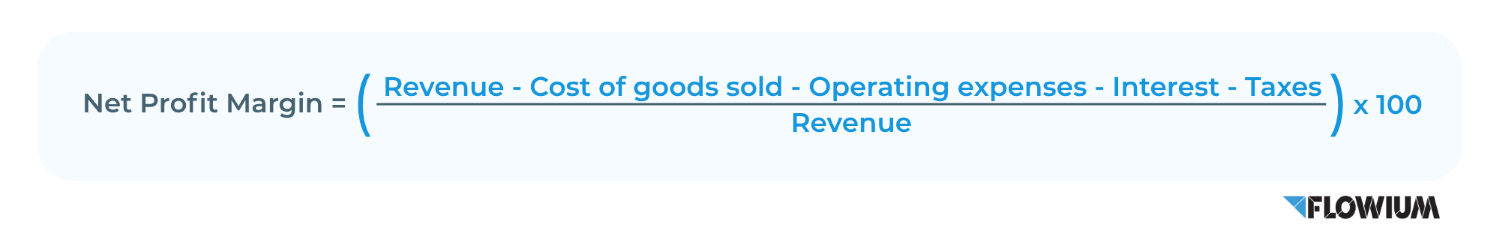
Net profit margin is the amount of revenue left after subtracting all expenses — including COGS, marketing, fulfillment, rent, utilities, salaries, software, taxes, and interest. It shows how much actual profit your business keeps from every dollar earned.
When your net margins are low, it indicates that expenses are eating into your revenue, even if sales are strong. Higher net margins mean your business is efficient, sustainable, and capable of long-term growth.
How to calculate:
Example:
Using the same ecommerce company:
- Revenue = $20,000
- COGS = $5,000
- Rent = $1,500
- Utilities = $500
- Marketing = $2,000
- Payroll = $4,000
- Loan Interest = $500
- Taxes = $1,400
- Total Expenses = $15,900
Net Profit Margin = (20,000 – 15,900) ÷ 20,000 × 100 = 20.5%
General Benchmark:
Most ecommerce businesses aim for anet profit margin of 10-20%, though this varies by industry and growth stage.
Customer Acquisition Cost (CAC)
Customer Acquisition Cost (CAC) is the total cost of acquiring a new customer, including marketing spend, discounts, promotions, and paid advertising.
When your CAC is high, it becomes harder to achieve profitability, especially if customers don’t return to make additional purchases. Lower CAC allows you to scale more efficiently and reach profitability faster.
How to calculate:

Example:
An ecommerce company spends $10,000 on marketing in a month and acquires 200 new customers.
CAC = 10,000 ÷ 200 = $50 per customer
General Benchmark:
$45–$175 is the average CAC for ecommerce. Top-performing DTC brands aim for CAC that allows them to break even (or better) on the first purchase, relying on retention to drive long-term profit.
Conversion Rate
The percentage of website or digital platform visitors that complete a desired action is known as conversion rate (CVR), and it is a crucial metric in digital marketing. A conversion can be any valuable action, such as making a purchase, clicking on a call-to-action (CTA) button, or becoming a customer.
When your conversion rate is low, it means many visitors leave without taking action. Improving CVR helps you get more value from your existing traffic without increasing acquisition costs.
How to calculate:

Example:
An ecommerce website has 5,000 visitors in a month and yields 125 purchases.
Conversion Rate = (125 ÷ 5,000) x 100 = 2.5%
General Benchmark:
According to Shopify, ecommerce conversion rates typically range from 2.5% to 3%. It’s a good idea to start with a baseline of 2.5% and continue optimizing from there.
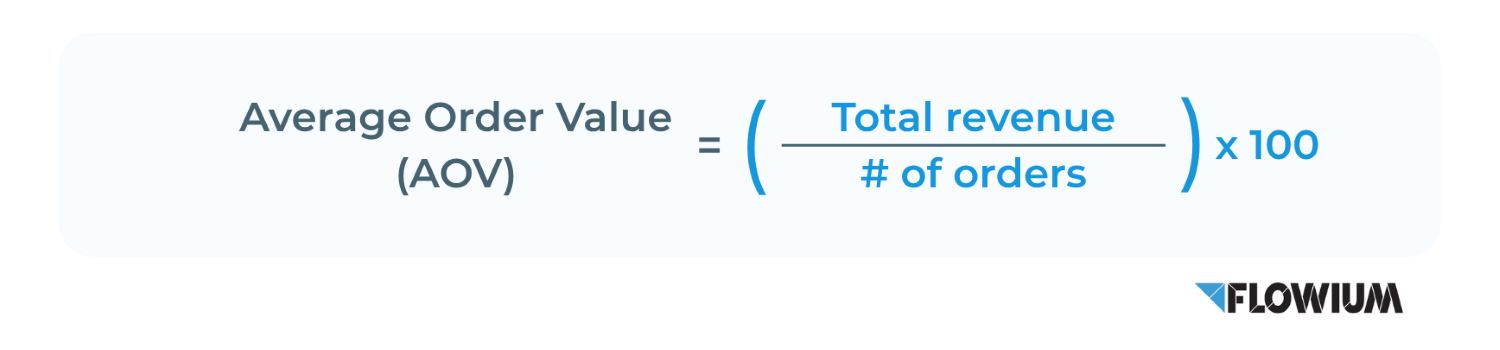
Average Order Value
Average Order Value (AOV) is calculated by dividing total revenue by the number of orders. When your AOV increases, profitability improves without increasing CAC. Common ways to boost AOV include bundling, minimum-order thresholds, upsells, and cross-sells. You can find out about more strategies to improve this metric in our podcast.
How to calculate:
Example:
An ecommerce store generates $12,000 in revenue from 150 orders.
AOV = 12,000 ÷ 150 = $80
General Benchmark:
AOV for ecommerce is typically between $50 and $150, depending on the category. Best-in-class brands use product recommendations and bundles to increase AOV by 10-30%.
Customer Lifetime Value
Customer Lifetime Value (LTV or CLV) is the total amount of revenue a customer generates for your brand over the course of their relationship, minus any direct costs. When your LTV is high, it indicates strong retention, effective upselling, and a well-aligned customer experience across marketing and product.
Explore more optimization strategies, tips, and examples in our complete guide on customer lifetime value.
How to calculate:
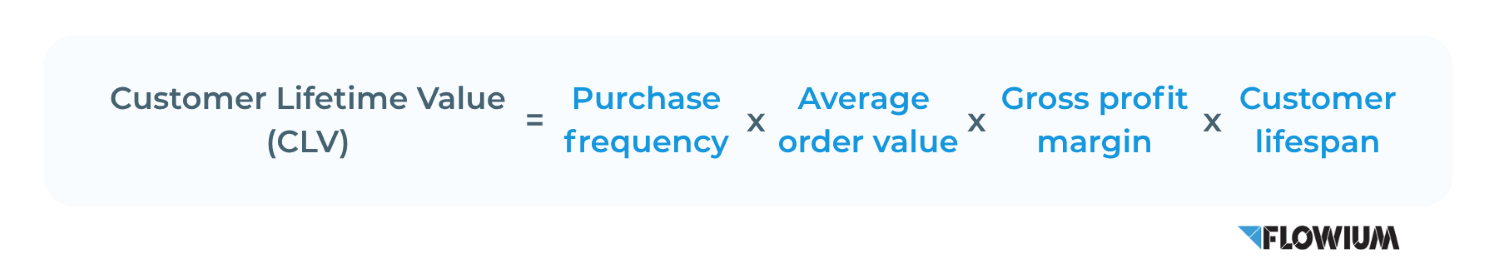
Example: An ecommerce brand has:
Average Order Value = $80
Purchase Frequency = 4 times per year
Gross Profit Margin = 75%
Customer Lifespan = 2 years
LTV = 80 × 4 x 0.75 x 2 = $480
General Benchmark:
Depending on the category, the average ecommerce LTV ranges from $150 to $250, while top-performing stores have $250-$450 LTV, according to Shopify data. Brands with strong retention and upsell strategies often see LTV grow 3-5 times within the first year.
LTV:CAC Ratio
The LTV:CAC ratio compares LTV to CAC, showing how sustainable your growth is. A higher ratio indicates that each customer generates more value than the cost to acquire them. When your ratio is low, it signals that acquisition costs are too high relative to customer value. A strong ratio suggests profitable growth and efficient marketing.
How to calculate:

Example: An ecommerce brand has:
- LTV = $480
- CAC = $60
LTV: CAC Ratio = 480 ÷ 60 = 8:1
General Benchmark:
According to Shopify, ecommerce businesses should aim for a 3:1 or 4:1 ratio, which is considered healthy. Ratios below 1 indicate unprofitable acquisition strategies.
Repeat Purchase Rate
Repeat Purchase Rate measures the percentage of a company’s customers who make more than one purchase over time. It reflects how well a business retains its existing clientele. A customer is counted as a repeat purchase if they return to complete another transaction after their initial purchase. A higher repeat purchase rate indicates stronger customer loyalty and effective retention strategies.
How to calculate:

Example:
An ecommerce store has 500 customers in a year, and 150 of them make more than one purchase.
Repeat Purchase Rate = (150 ÷ 500) × 100 = 30%
General Benchmark:
Retailers and ecommerce sellers typically aim for a repeat purchase rate of 20–40%, depending on the category and product type.
Cart Abandonment Rate
Cart Abandonment Rate measures the percentage of online shoppers who add items to their shopping cart but leave without completing the purchase. It reflects the proportion of interested potential customers who fail to convert. When your abandonment rate is high, it indicates friction in the purchase process or issues with pricing, shipping, or checkout. Reducing abandonment can directly increase revenue without acquiring more traffic.
How to calculate:

Example:
An ecommerce store had 1,000 shopping carts created in a month, and 720 of them were abandoned before purchase.
Cart Abandonment Rate = (720 ÷ 1,000) × 100 = 72%
General Benchmark:
According to Baymard’s report (2025 data), the average ecommerce cart abandonment rate is 70.19%. Businesses often use strategies like cart recovery emails or exit-intent offers to lower this rate.
Ecommerce Profitability Benchmarks by Industry
After reviewing general KPIs across all ecommerce segments, let’s break down the key profitability benchmarks of ecommerce stores by niche. The numbers represent typical ranges for direct-to-consumer (DTC) ecommerce brands based on aggregated industry reports and Shopify store benchmarks. It’ll give you a more detailed perspective on the state of things in your particular industry.
| Ecommerce Industry | Typical Gross Margin | Typical Net Profit Margin | Typical Average Order Value |
|---|---|---|---|
| Beauty & Cosmetics | 50–70% | 10-20% | $70–80 |
| Apparel & Fashion | 40–60% | 5-13% | $185–200 |
| Electronics and Tech | 15–30% | 3-10% | $200+ |
| Health & Wellness / Supplements | 40–55% | 10-20% | $80–120 |
| Home & Garden | 35–50% | 8-18% | $240–260 |
| Pet Products | 35–45% | 8-15% | $80–90 |
| Food & Beverage | 25–45% | 5-12% | $110–120 |
| Luxury & Jewelry | 50–70+% | 15-30% | $430–450 |
As you can see, these benchmarks vary widely by product category, so what’s for one industry signifies success can mean a strategy failure for the other. For example, a 25% gross margin is strong for electronics but weak for beauty products because cosmetics have much higher markup potential.
This is why we emphasize the importance of researching and focusing on benchmarks for your specific industry. While learning general trends and working practices is good for your decision-making process, your first goal is to reach and overcome the level of competitors in your niche.
What Businesses Do to Meet Ecommerce Profitability Benchmarks
Speaking about reaching and overcoming general profitability benchmarks for ecommerce, we also have some tips to share. Our experts have vast experience in helping businesses find the weak points that impact their revenue generation, retention, and other issues preventing brands from meeting their profit goals. Here are some practices and tactics you can use.
- Optimize CAC. Reduce the cost of acquiring each customer while maintaining growth.
- Increase AOV. Encourage customers to spend more per purchase.
- Improve Customer Retention. Drive repeat purchases to increase customer lifetime value.
- Optimize Product Pricing. Adjust pricing strategically to protect margins while remaining competitive.
- Reduce Returns and Refunds. Lower operational costs tied to product returns.
- Improve Conversion Rate. Increase the percentage of visitors who complete a purchase.
- Streamline Fulfillment and Logistics. Lower shipping and handling costs while maintaining reliable delivery.
- Focus on High-Margin Products. Prioritize products that generate the most profit.
- Automate Marketing Operations. Use automation to scale marketing efficiently without increasing overhead.
Read our comprehensive guide on Ecommerce Profitability to find more actionable optimization strategies.
How Flowium Helps Clients Meet Ecommerce Profitability Benchmarks
Flowium’s experience in helping DTC ecommerce brands to meet key profitability benchmarks isn’t just words. We have a track record of successful cases to prove it. Let’s look at one of the cases together to see how professional agencies implement all the mentioned strategies in practice for brands to improve their KPIs.
One of our clients, a fashion ecommerce brand generating $2M-$5M in revenue, was underperforming on key profitability benchmarks, particularly low revenue from email, weak retention, and underutilized customer data.
Without increasing ad spend, we developed a strategy allowing the brand to focus on improving core metrics that directly impact profitability.
What we did to help the brand meet key benchmarks:
- Increased revenue per customer (LTV & retention)
They built and expanded lifecycle email flows designed to drive repeat purchases and long-term engagement.
- Improved conversion rate (CVR)
By launching targeted, behavior-based flows (e.g., abandoned cart, welcome), they captured high-intent users and converted more existing traffic.
- Grew owned audience (reducing CAC)
They implemented strategic pop-ups to increase email subscribers, allowing them to generate revenue without relying on paid acquisition.
- Built trust and brand engagement (retention benchmark)
Additional flows were created to highlight products, strengthen brand perception, and encourage ongoing interaction.
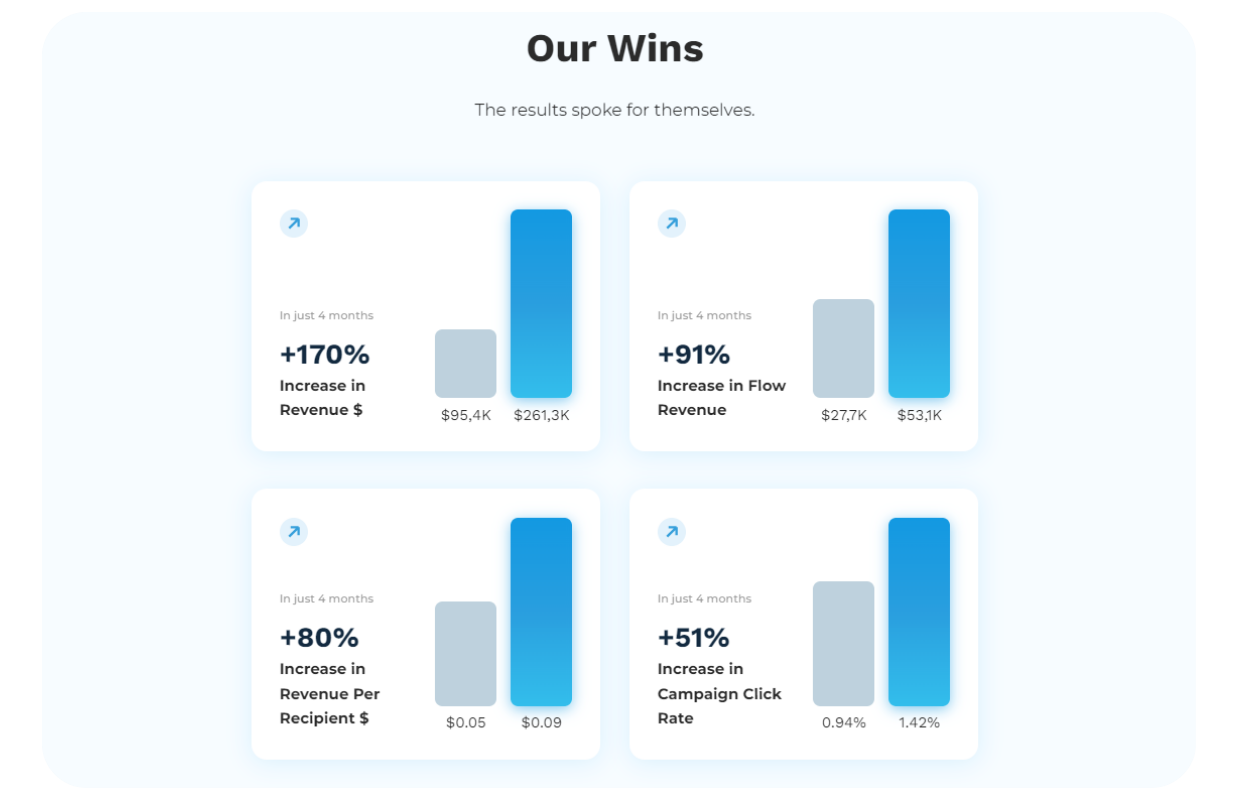
Results (Ecommerce profitability benchmarks impact):
- Revenue increased significantly in just 4 months
- Flow-driven revenue nearly doubled
- Email became a stronger revenue channel (improving LTV and reducing CAC dependency)
Conclusion
Keeping an eye on the key ecommerce profitability benchmarks and KPIs makes it easier to meet revenue targets and accurately measure your business development efforts. It helps you make more effective strategic decisions and provides you with information on the performance of your online store.
Do you need help understanding or improving your ecommerce benchmarks? Get in touch with Flowium now! We’ll show you how to gauge the success of email marketing, assist in pinpointing areas that need work, and implement successful marketing plans.
Frequently Asked Questions
What constitutes a healthy ecommerce profit margin?
Depending on the product category and business type, a healthy profit margin in ecommerce usually ranges from 20% to 40%. While low-margin businesses depend more on volume, high-ticket or specialty products may allow for better profits.
How profitable is ecommerce?
When properly handled, ecommerce can be profitable. Product margins, customer acquisition costs, operating expenses, and retention rates all affect profitability. Strong net profits are frequently seen by brands with effective marketing and improved supply chains.