When you start your online store and set up digital marketing, it’s critical to know which strategies work in your favor and what you need to optimize. Otherwise, you’ll lose valuable resources and time on pointless tactics. Establishing precise KPIs and tracking ecommerce metrics is the fundamental solution for this problem.
“What exactly are those?”, you may ask.
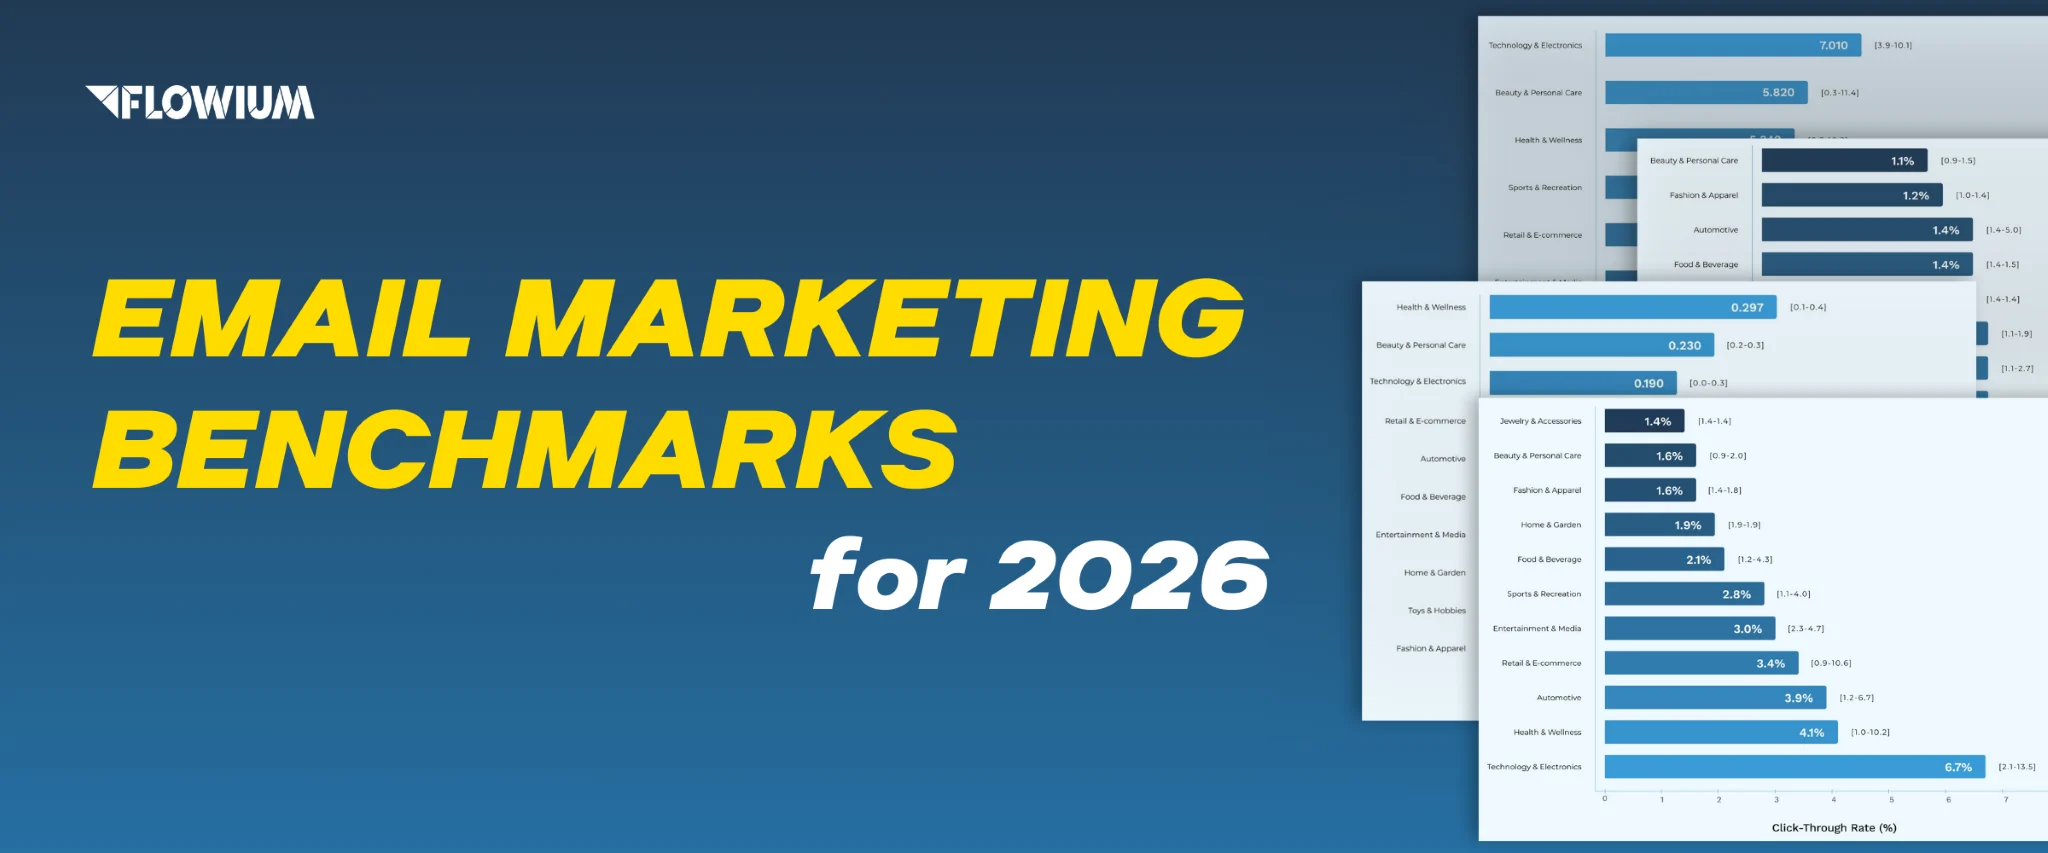
We’ll give you a comprehensive answer in this guide, where our marketing specialists share a list of all key ecommerce metrics, calculation methods, and industry benchmarks. Read ahead for valuable insights.
What Are Ecommerce Metrics?
Ecommerce metrics are crucial data and analytics that aid in determining a firm’s general success. They are numerical data used to monitor specific behaviors. Metrics provide you with a glimpse of how people have behaved on your website in the past, which you may use to guide future improvements.
These business metrics assist you in determining which products are popular, how frequently specific products are bought, whether there are any problems with the checkout process that prevent new customers from converting, and much more.
Why tracking ecommerce metrics is important
By monitoring the fundamental ecommerce KPIs, you can learn all about the efficiency of your operations, assess client relationships, and marketing strategies.
Ecommerce analytics, metrics, and KPIs: What’s the difference?
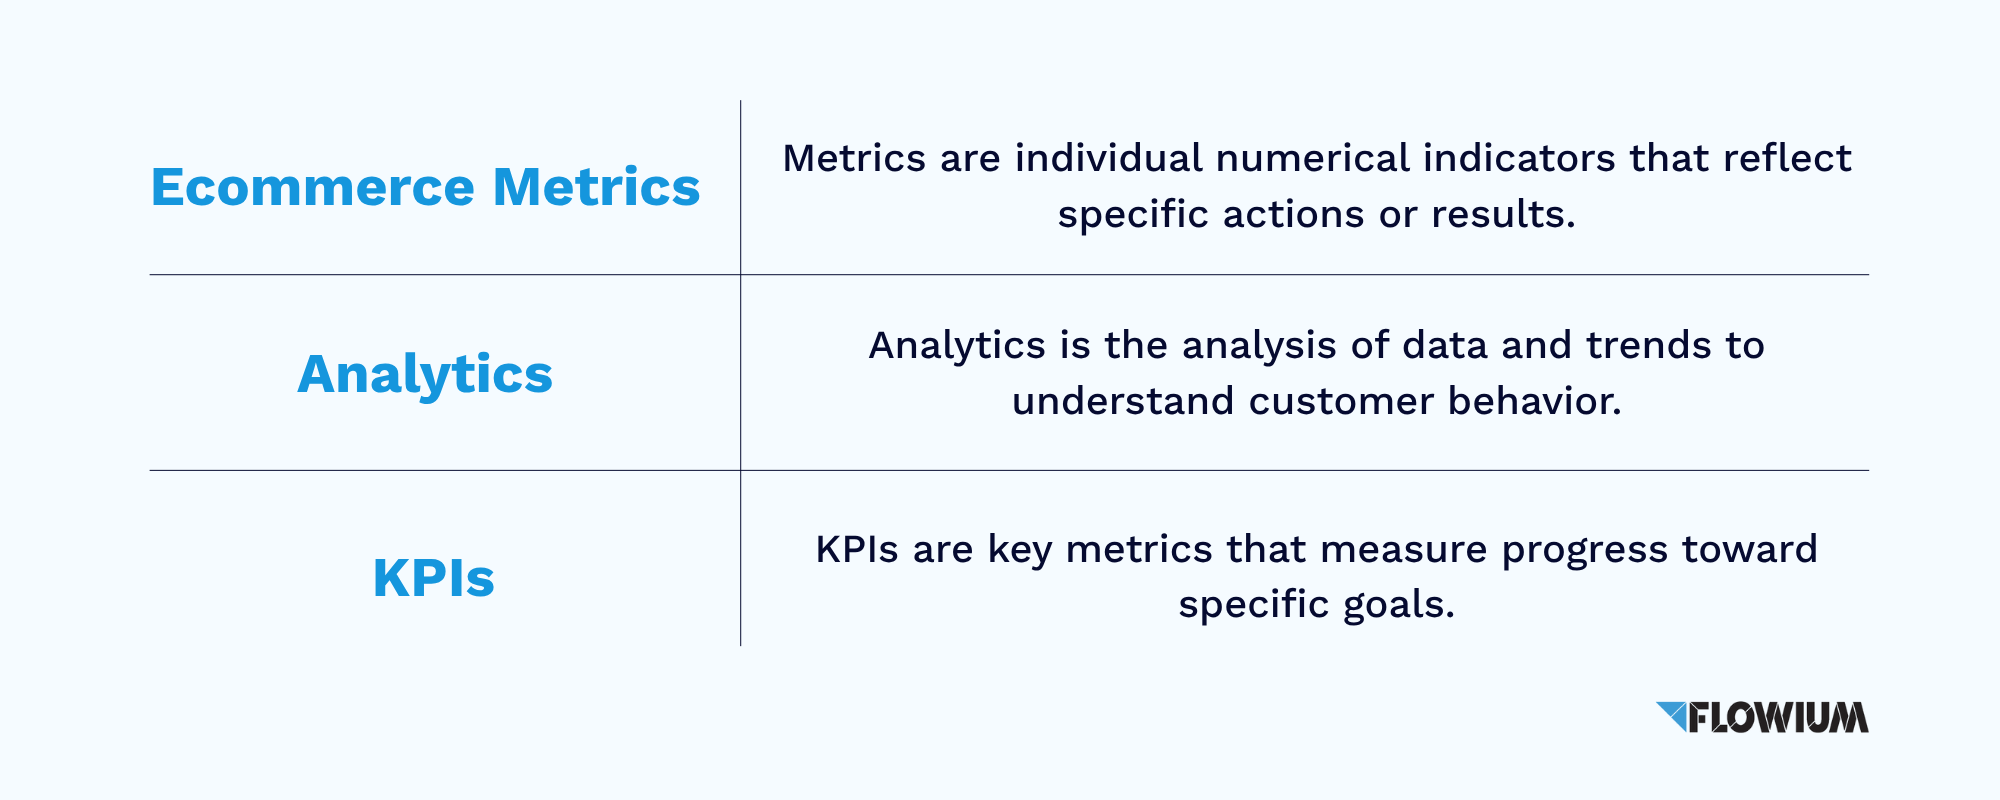
When starting with defining ecommerce performance, you might come across a few closely related terms, which are analytics, metrics, and KPIs. We’ve already established the meaning of ecommerce metrics. So, here’s a short clarification for the remaining terminology to rid you of any confusion.
- Analytics refer to the data and techniques used to comprehend customer behavior and enhance the experience. This comprises monitored measurements, qualitative information gleaned from sources, and understandings gained by examining the background, patterns, and trends in your data.
- KPIs are precise measurements used to monitor advancement toward a predetermined objective. These objectives can be specific for each individual strategy, so the KPIs will also differ from business to business.
Now that we’re over the basic terms, let’s start deciphering the most important ecommerce metrics.
Shortlist of Top Ecommerce Metrics to Track
Before diving in detail on every indicator, let’s list all the most important metrics in a cheat sheet.
- Ecommerce Website Traffic
- Traffic Source
- Cost Per Acquisition (CPA)
- Customer Acquisition Cost (CAC)
- Opt-In Rate
- Impressions
- Reach
- Engagement Rate
- Average Session Duration
- Click-Through Rate (CTR)
- Bounce Rate
- Scroll Depth
- Add-to-Сart Rate
- Conversion Metrics
- Conversion Rate (CVR)
- Shopping Cart Abandonment Rate
- Micro to Macro Conversion Rates
- Average Order Value (AOV)
- Customer Lifetime Value (CLV or LTV)
- Revenue by Channel
- Return On Ad Spend (ROAS)
- Average Revenue per Unit
- Ecommerce Churn Rate
- Refund and Return Rates
- Customer Retention Rate
- Net Promoter Score (NPS)
- Customer Satisfaction (CSAT)
- Email Open Rate
- Unsubscribe Rate
- Email List Growth Rate
- Email Conversion Rate
- Email Click-Through Rate
As you can see, the list isn’t that short, but all of these indicators are highly important for measuring the performance and overall success of your ecommerce brand.
Of course, some of them have more significance for evaluating the efficiency of your operations, while others add insights for a better understanding. To provide you with more perspective on what metrics you should prioritize, we asked one of our specialists to give a comment.
Q/A with Flowium’s Expert
Q: What ecommerce metric would you consider the most important?
A: “Customer Lifetime Value (CLV). It reflects not just a single sale, but the strength of your entire customer journey. In a world where ad costs are rising, knowing how much a customer is worth over time is essential for scaling smart.”Cassidy Paulus
Client Services Director
Acquisition and Awareness Metrics
A successful customer acquisition strategy is a sure way for your business to survive high competition and build the foundation for long-term revenue. To measure the performance of your tactics on this stage, you have several ecommerce metrics to track. Knowing these indicators will help you to set up processes at an early stage of achieving product-market fit, basic growth, and traction.
Ecommerce Website Traffic
The number and the quality of visits to your website define your website traffic. Total visits or page views are two ways to gauge traffic, and many businesses carefully monitor how long the typical visitor stays on the website. Both paid (retargeting, affiliate marketing, and search and social media advertising) and free (organic search, social media, direct word-of-mouth, and referral) sources contribute to website traffic. To increase website traffic, businesses need to put in the time and effort to create compelling content marketing and conduct cost-efficient promotion.
How to measure:
You can measure the traffic to your website using a variety of available platforms, like Google Analytics. This and other robust online marketing management packages offer the most potent instruments. To get a comprehensive picture of these ecommerce key metrics, pay attention to:
- Average time on page;
- Visitor type (New or returning);
- Bounce rate;
- Traffic source (organic, direct, socials, or referrals);
- Total number of visits;
- Conversion rate;
- Exit rate.
Ecommerce performance benchmark:
Due to variations in business size, audience behavior, content strategy, and market conditions, website traffic benchmarks can vary greatly. Therefore, we recommend businesses create their own benchmarks for this metric based on the particular ecommerce segment and competitors.
Traffic Source
To achieve the objective of gaining traction on your website, you need to identify the most efficient source to determine which channel to develop. By looking at your online store sessions by traffic source report, you can see how people got to your website.
The most typical sources of traffic are:
- Search (your website appeared on the search engine result page)
- Direct (a customer enters your website address straight into the URL bar)
- Social (from a link on a social media platform)
- Paid (from any type of paid advertisement)
- Email marketing traffic (from a link in an email message)
How to measure:
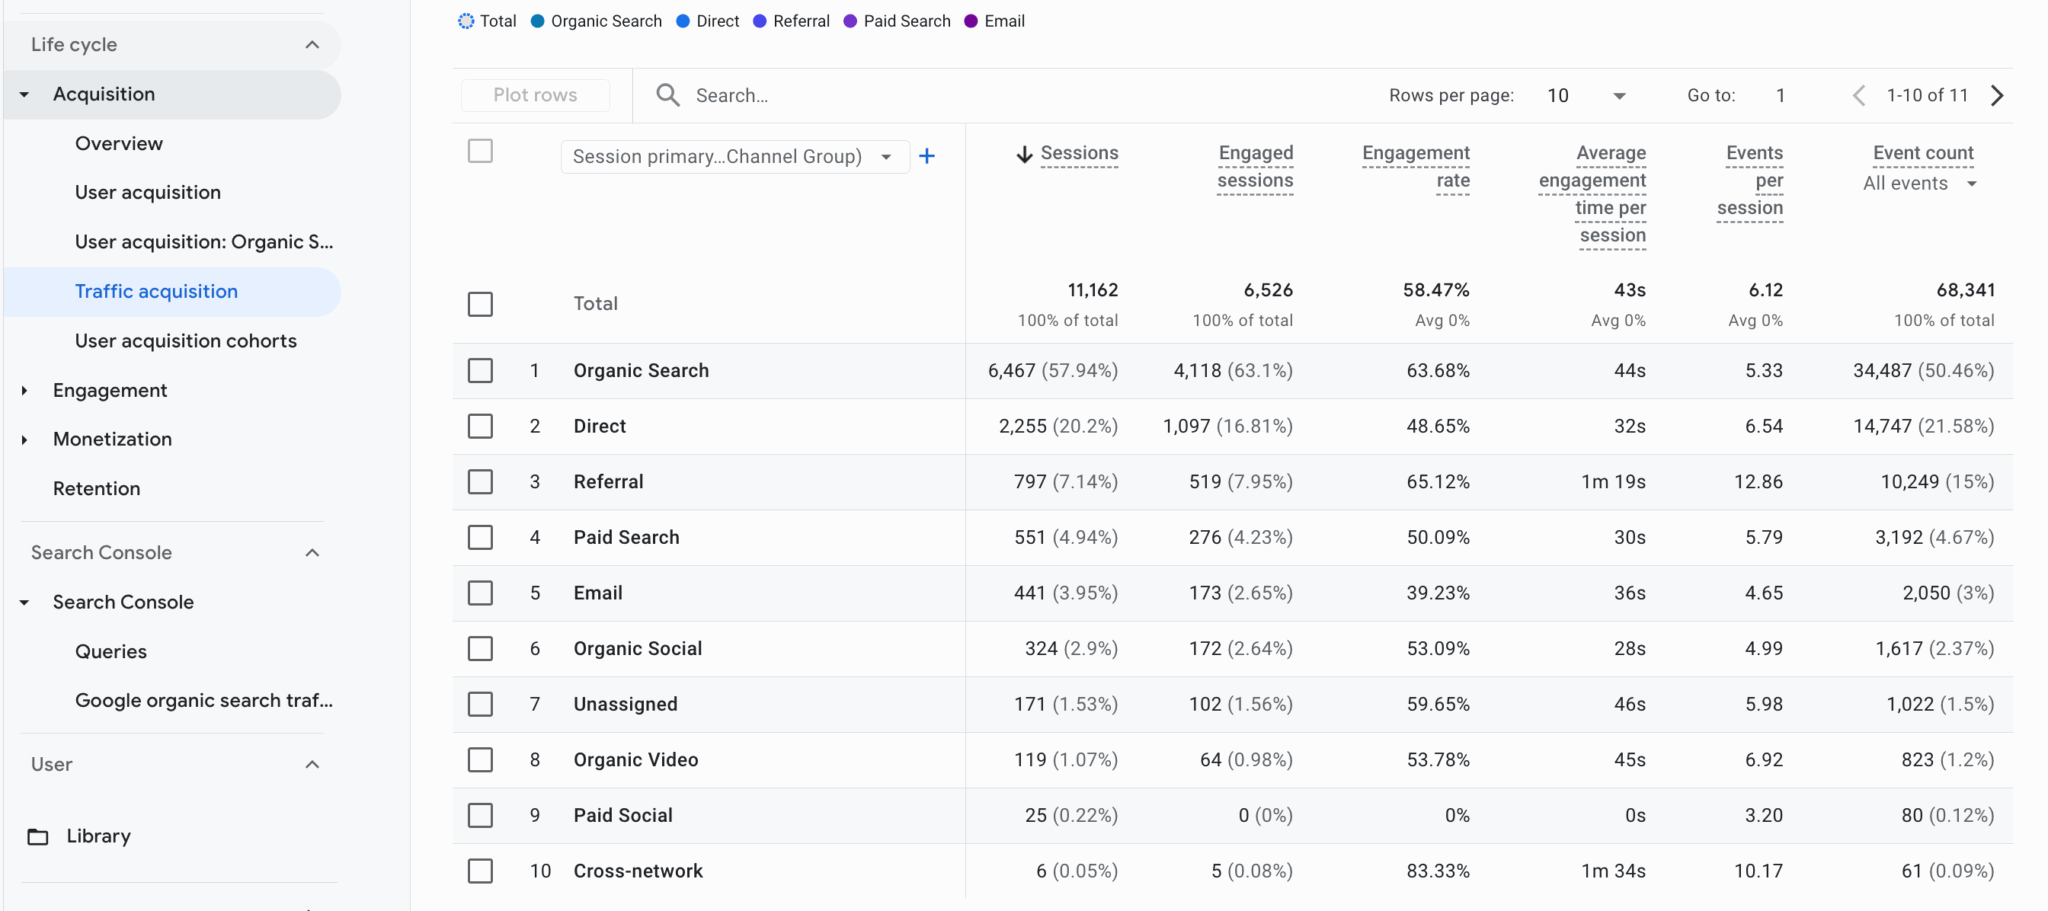
Use traffic analytics platforms to find information about the most successful traffic source. In Google Analytics, you can find it on the Acquisition panel.
Cost Per Acquisition (CPA)
Cost-per-action, or CPA, is a crucial indicator of how much it costs to obtain a conversion. These can include anything, ranging from making a purchase to filling out a lead generation form.
How to measure:
The following information is necessary if you’re trying to measure your CPA for any actions made on your website:
- The amount of money spent on the targeted promotional campaign
- The number of users who have converted
Then you simply divide the first number by the second to get this ecommerce metric.

Industry benchmark:
According to Serpilot, the average cost per acquisition in the e-commerce space is approximately $70. Product margins, advertising methods, and seasonal trends all have an impact on these ecommerce measurements.
Pro Tip: By carefully controlling your campaign budgets, creating landing pages that support your call-to-actions, and segmenting your campaigns to better target customers, you can increase your CPA.
Customer Acquisition Cost (CAC)
CAC is similar to CPA but a broader measurement that determines the amount of money your business spends to draw in new clients. Here, we need to account for all the costs and resources involved in drawing in a potential client and turning them into a paying one.
This comprises:
- Marketing costs (content production, SEO, and advertising);
- Commissions and salaries for sales teams;
- Software and tools for the sales and marketing process;
- Overhead expenses associated with client acquisition.
You can use this indicator to gauge how well your marketing and sales initiatives work.
How to measure:
The formula for Customer Acquisition Cost (CAC) is straightforward. You need to divide the Total Marketing Spend by the Number of New Customers Acquired

Benchmark:
According to the report by UpCounting, the average CAC in 2025 across industry segments is $78, with a range of $28–400.
Opt-In Rate
The proportion of website visitors who agreed to receive push notifications, emails, or SMS from you is known as your opt-in rate. The efficacy of your sign-up forms and overall subscriber acquisition approach is indicated by the opt-in rate.
How to measure:
To determine your rate of opt-in, subtract the number of subscribers from the total number of people who visited your website in a specific period. The percentage can be calculated by multiplying that amount by 100.

Benchmarks:
The optimal opt-in rate might vary greatly across industries and audiences, hence, there are no common standards that define it. Monitoring it over time and contrasting performance from the past and present is the greatest way to assess yours.
Impressions
When an advertisement or other digital media appears on a user’s screen, it creates an impression. This ecommerce metric is important for tracking customer awareness of your brand and offers.
Important Note: Marketers consider impressions a vanity metric, meaning that while showing spectacular numbers, they don’t necessarily yield business results. They show visibility but don’t guarantee sales.
How to measure:
To assess the effectiveness of campaigns, use impression tracking, which includes:
- Actual clicks compared to pay-per-click impressions
- The frequency of appearance on social media
- Views of internal calls to action from the site
- Using third-party websites like Google Image Search to access visual assets
Reach
Reach is the total number of individuals who view your company’s ads or other content. This metric indicates how many separate individuals have viewed your material, as opposed to impressions, which can count numerous views by the same person.
How to measure:
To gauge the reach of your promotions and content, use digital analytics tools.
Engagement Ecommerce Metrics
After the acquisition, it’s crucial to keep your customer engaged and interested in your brand. Tracking engagement indicators will help you to optimize your strategies and promptly react to changes in client behavior.
Engagement Rate
Engagement rate (ER) is a metric that measures the amount of interaction your content gets from your audience through various digital platforms.
How to measure:
The methodology for measuring ER will differ depending on the channel. For example, for assessing engagement on social media, you can use impressions and follower count to determine your engagement rate. Here are the formulas that you can use:
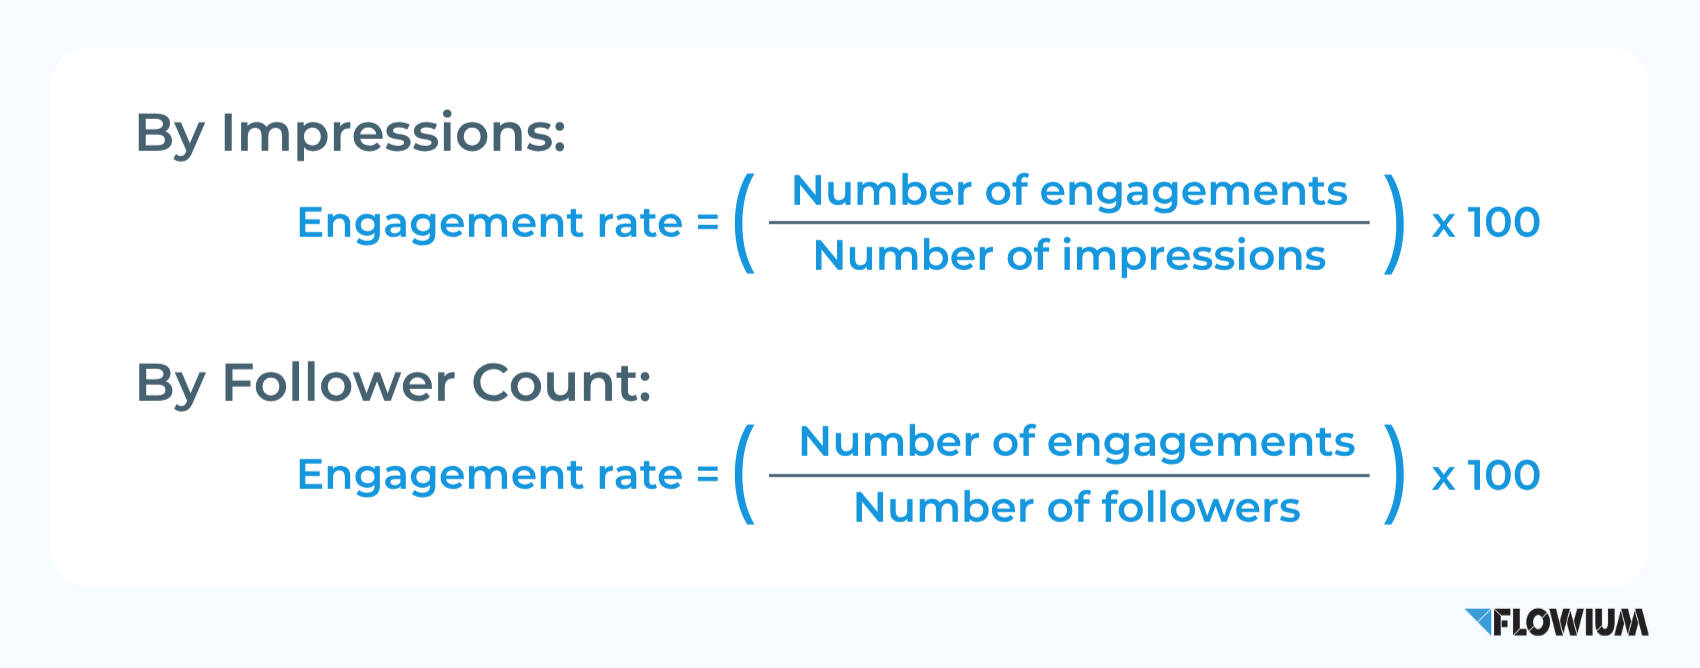
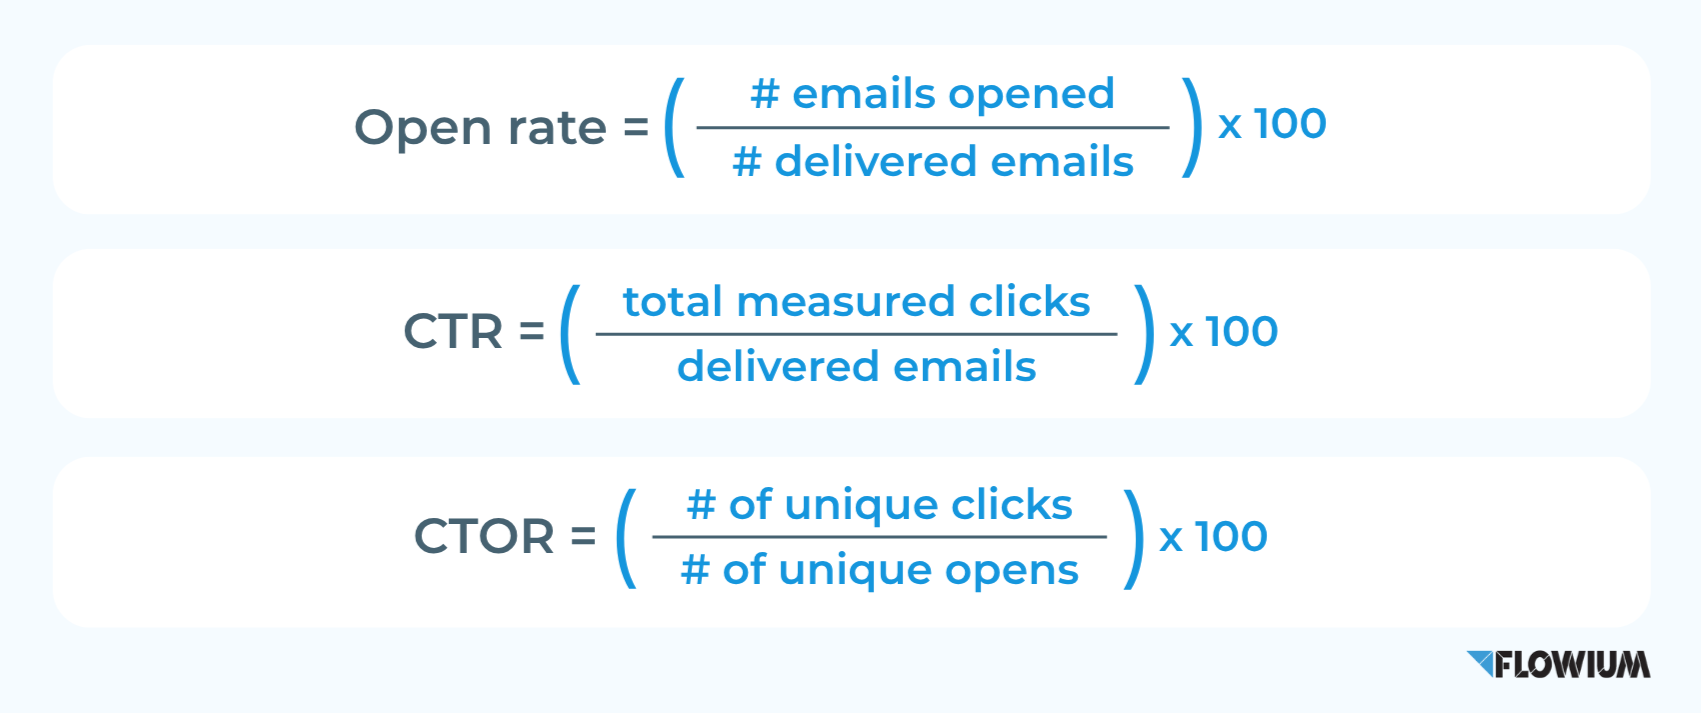
At the same time, to evaluate engagement for email marketing, you need to monitor the following indicators:
- Open rate
- Click-through rate
- Click-to-open rate
Here are the formulas for calculating these rates:
Industry benchmark:
The definition of a good engagement rate will differ depending on the audience demographics, content type, channel, and industry.
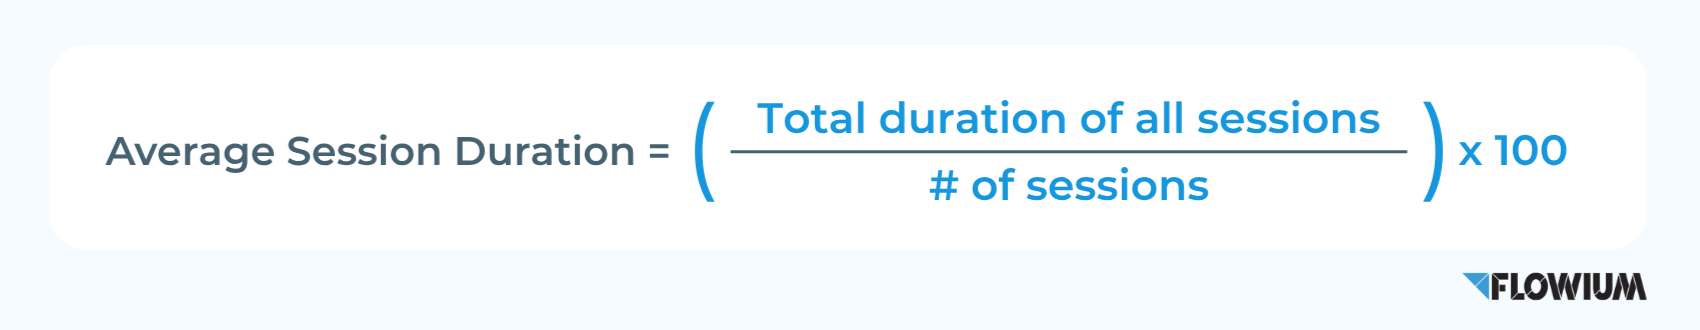
Average Session Duration
The average amount of time a visitor spends on an e-commerce website in a single visit is known as the “session duration.” Generally speaking, a longer session length suggests that users are more interested in the material, which may increase conversion rates.
How to measure:
You can calculate it by dividing the number of sessions during a certain period by the total amount of time spent by all visitors.
Click-Through Rate (CTR)
Your click-through rate (CTR) is the percentage of people who visit your website after clicking on an email campaign, ad, or social media post.
How to measure:
The method for measuring this ecommerce metric will depend on the channel you evaluate. To give you information on what indicators and rates you might need, we can generalize the formula as follows:

Bounce Rate
Bounce rate indicates how many users visited your website and then departed without taking any action, such as clicking to another page, filling out a form, purchasing a product, etc.
How to calculate:
Marketers usually use web analytics tools like Google Analytics to measure bounce rate.
Industry benchmark:
Because e-commerce websites want customers to purchase and browse additional product pages, according to Adobe for Business they usually have a 20% to 45% bounce rate.
Scroll Depth
A website metric called “scroll depth” gauges how far a user scrolls down a page. Similar to tracking page views on a multi-page website, scroll depth can also be used to gauge interest on a single page.
Scroll depth is an important metric of user engagement because it shows how much of your material people consume. By displaying how far users are scrolling, which areas of the page they interact with, and where they could be losing interest, scroll depth offers a more thorough picture of user interaction.
Pro Tip: Read our guide on heatmaps to find out more information on the topic.
Add-to-Сart Rate
The percentage of visitors who add an item from an online store to their cart is known as the Add-to-Cart Rate. This measure is crucial for businesses to comprehend since it allows them to assess how well they’re converting clients. Your conversion rate will be higher if the Add-to-Cart Rate is higher.
How to calculate:
The add-to-cart rate is determined by dividing the total number of website sessions by the number of sessions in which an item was added to the cart via the cart button (excluding abandoned carts).

Benchmarks:
According to Dynamic Yield, the average add-to-cart rate in ecommerce as of the end of 2024 was almost 6%. A good ATC rate typically ranges between 8% to 10%.
Conversion Metrics
Conversion Rate (CVR)
A key indicator in digital marketing, conversion rate, or CVR, is the proportion of visitors to a website or digital platform that finish a desired action. Any desired action you want the user to take, such as clicking on a call-to-action (CTA) button, completing a purchase, or becoming a new customer, can be referred to as a conversion.
How to assess:

Industry benchmark:
Shopify states that the average ecommerce conversion rates are from 2.5% to 3%. Setting a baseline of 2.5% is a smart place to start, but continue to use conversion rate strategies to maximize this.
Shopping Cart Abandonment Rate
The percentage of online shoppers who add products to a virtual shopping cart but then remove them before making a purchase or leave purchasing not finalized is known as the shopping cart abandonment rate. Concerning the total number of shopping carts formed, it displays the percentage of interested potential customers who depart without making a purchase.
How to measure:
Use this algorithm to determine your shopping cart abandonment rate.

Average rate:
According to Statista, the average cart abandonment rate for ecommerce is rather high at approximately 70–75%. To lower this number, businesses need to apply special strategies like sending cart recovery emails.
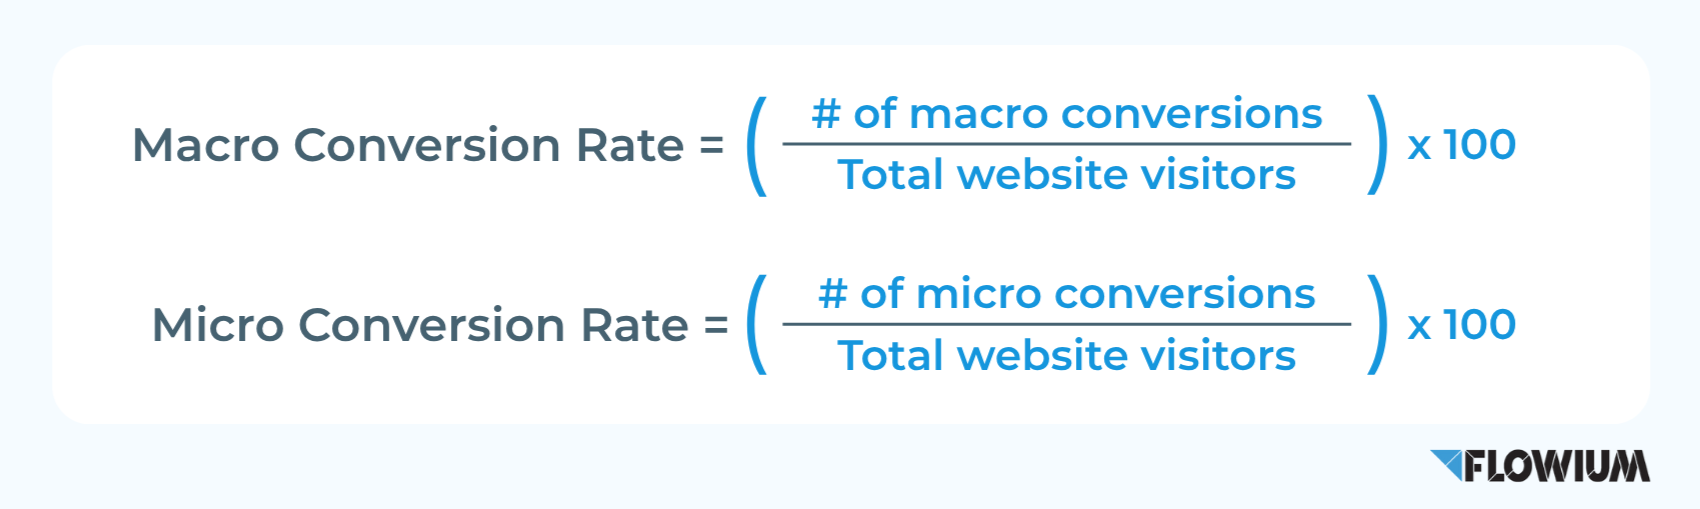
Micro to Macro Conversion Rates
The major action you are encouraging clients to perform is a macro-conversion, which is your core business aim. A sale is typically a macro-conversion in e-commerce. Little victories for your business that indicate a user’s likelihood of making a macro-conversion in the future are known as micro-conversions. It’s time to nurture a user into conducting business with you after they’ve finished a micro-conversion.
How to calculate:
The entire number of desired macro actions on your website must be ascertained in order to estimate the macro conversion rate. The observed number is divided by the total number of website visitors. Lastly, to turn the answer into a percentage, multiply the result by 100.
Use the same formula to determine the micro conversion rate. The sole distinction is that you must take into account the quantity of intended micro activities on your website rather than macro actions.
Performance and Revenue Metrics
Metrics used to evaluate a company’s revenue are called revenue metrics. These measurements, which assess the overall effectiveness of these strategies and assist the firm in optimizing its future efforts, are an essential component of revenue enablement initiatives. Here are some of the most important revenue indicators to track and how to calculate them if you’re unsure where to begin.
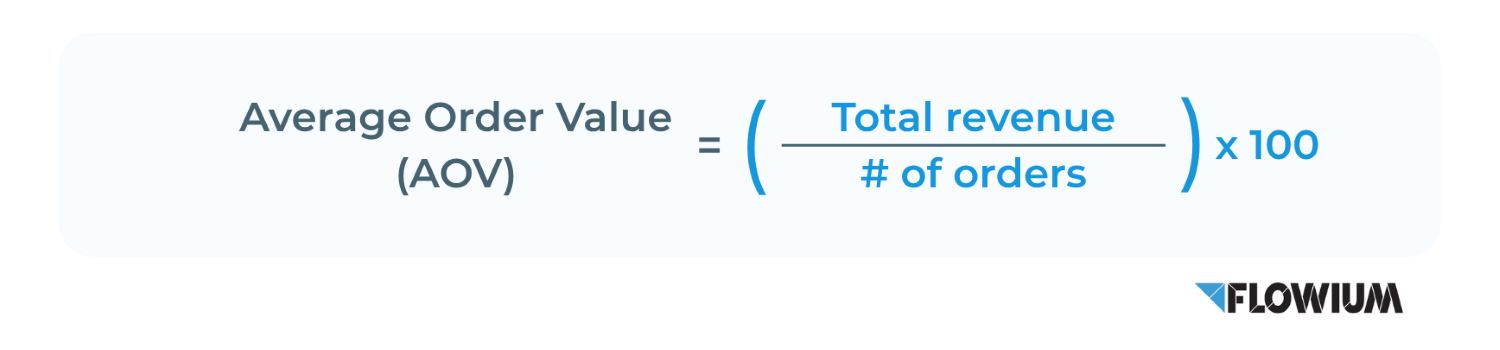
Average Order Value (AOV)
Average order value (AOV) measures the typical amount of money spent by customers when they place an order on a website or application. AOV trends have an impact on the company’s important business choices, such as marketing and product pricing.
How to measure:
When you understand what motivates your customers to buy and how much they spend on average, you can plan your goal-setting activities to increase transaction volume. Here’s the formula for measurement.
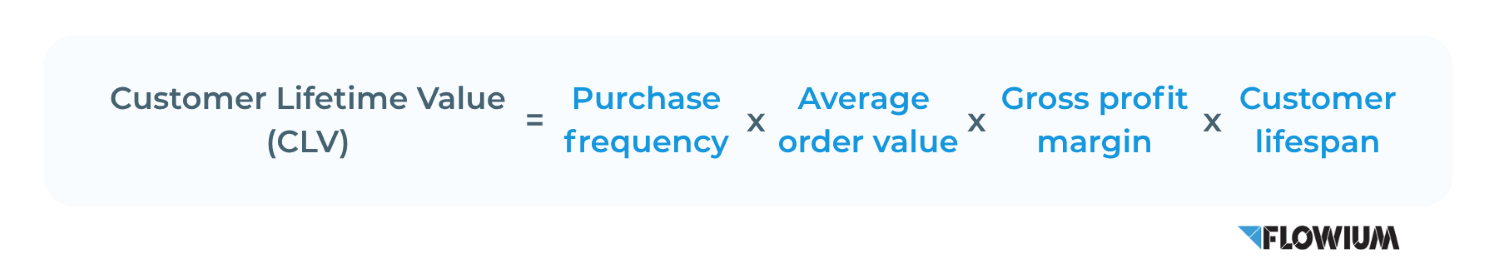
Customer Lifetime Value (CLV or LTV)
Customer lifetime value (CLV or LTV) evaluates a customer’s overall value to a company over the life of their whole association with that company. For organizations to comprehend the significance of preserving customer loyalty and enhancing customer experiences generally, this metric is crucial.
How to calculate:
The CLV formula calculates a customer’s total value over their lifetime, allowing you to compare the cost of acquiring new consumers to the revenue they generate throughout their association with your company.
AOV ecommerce benchmark:
According to ECDB, in the global ecommerce market, it is valued at $116 in 2024.
Revenue by Channel
Revenue by channel reveals which channels of communication or advertising are generating the most income for your business.
How to measure:
You can track the revenue generated by a variety of channels by using a web analytics service such as Google Analytics. To determine the efficacy of advertising on particular channels, you can also examine data from those channels. To maximize your budget, you should modify the amount of money you invest in each channel as you track the revenue generated by each one.
Return On Ad Spend (ROAS)
The amount of money you made from an advertisement about the amount you paid for it is shown by your return on ad expenditure. You can be sure your marketing efforts are yielding the desired results when you are aware of this metric.
How to calculate:
You need to divide the amount you made from an ad campaign by the amount you spent to determine your return on ad expenditure. The percentage can then be obtained by multiplying by 100.

Average Revenue per Unit
The average revenue per unit, or ARPU, is a crucial KPI for inventory management and ecommerce that shows how much you typically make from selling one item of inventory. It’s frequently utilized in subscription-based businesses and serves as a gauge of the amount of money you make from each user or member.
ARPU is primarily utilized by software-as-a-service firms, phone carriers, internet service providers, and the media and streaming sectors. Additionally, it can be applied to membership-based ecommerce companies and subscription box services.
How to measure:

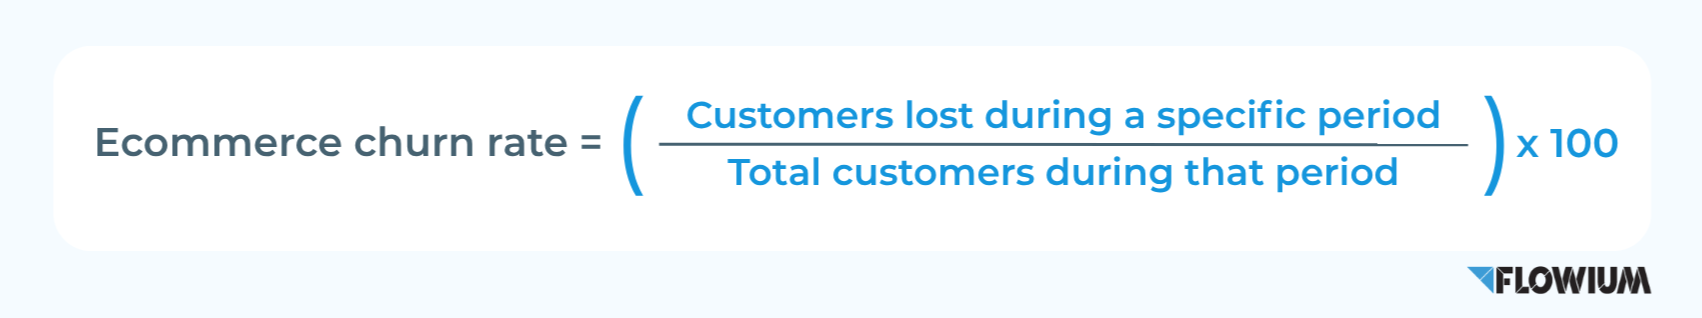
Ecommerce Churn Rate
The churn rate, which takes into account the proportion of people who choose not to be customers or subscribers within a given period, or even staff who choose to quit their positions, shows how much money or clients your company has lost. The reason the churn rate matters is that it shows how customers feel about your company. Because retaining current customers is far less expensive than acquiring new ones, you must determine how many consumers are opting to discontinue their relationship with your product or service to determine what steps to take to prevent this from happening.
How to measure:
Industry benchmark:
Businesses differ in what constitutes a strong e-commerce turnover rate benchmark, and there is no one-size-fits-all solution. According to some analysts, e-commerce companies should aim for a churn rate of 5%, although some companies can succeed with a far higher percentage.
Refund and Return Rates
Business owners can learn how much of their total sales is returned or reimbursed by looking at the refund rate. It is one method for monitoring your net sales and figuring out trends in profitability.
How to calculate:
To provide you with a complete view of sales and returns, refund rates are frequently computed in combination with chargeback rates, payment conversion rates, and checkout abandonment rates. Every business will handle the refund rate differently. To identify changes in your operations and possible fraud, it is helpful to perform calculations frequently.

Benchmarks:
In 2024, the National Retail Federation (NRF) and Happy Returns reported that the average return rate for ecommerce was 16.9%.
Retention and Loyalty Metrics
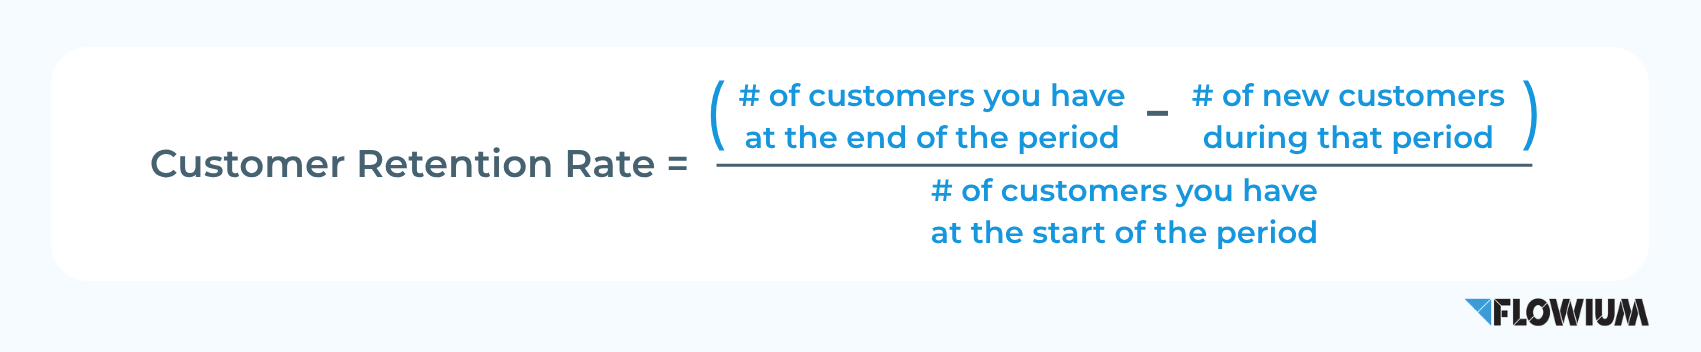
Customer Retention Rate
A company’s customer retention rate indicates the proportion of its clientele that it is retaining as opposed to losing. It is used for specific time frames, such as a trade month, quarter, or year.
How to estimate:
A percentage is used to represent the customer retention rate (CRR). The value is 100% if there is the same number of customers at the end of the term as there were at the start.
Benchmark:
According to CustomerGauge, across all industries, the average customer retention rate is 72.5%. However, based on your niche, this figure may change.
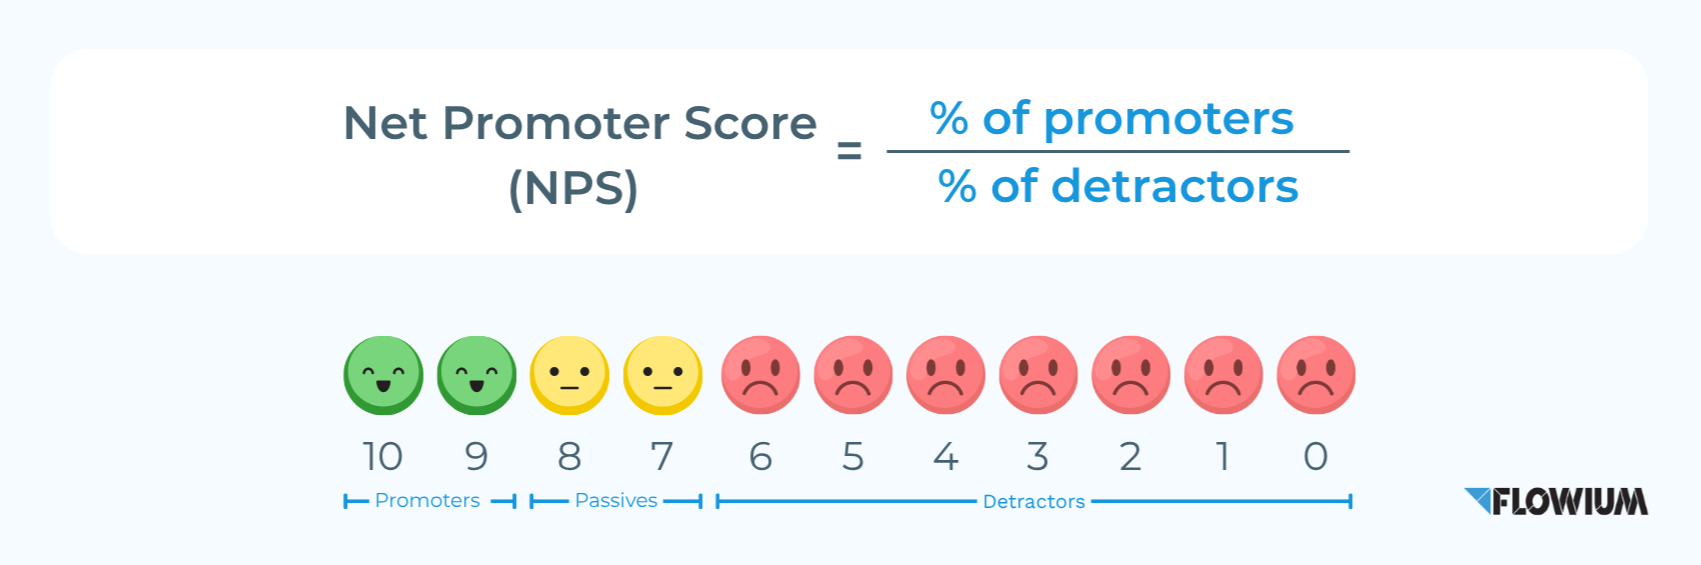
Net Promoter Score (NPS)
An NPS score calculates how loyal a consumer is by examining how likely they are to recommend a certain company. NPS® is frequently cited as the most reliable indicator of customer satisfaction.
How to measure:
A single-question survey is used to calculate your NPS score, which is then provided as a number on a scale, where a higher number indicates better satisfaction.
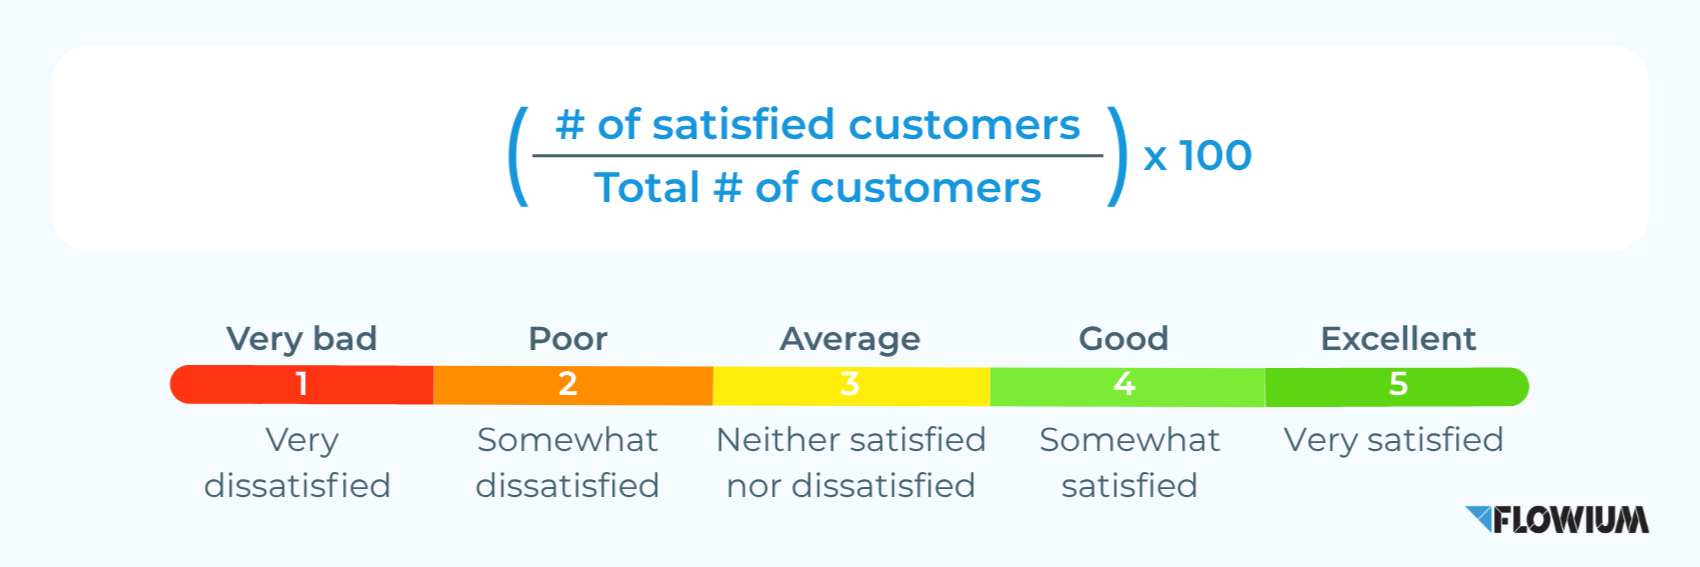
Customer Satisfaction (CSAT)
Customer satisfaction score, or CSAT, is a widely used indicator of how happy customers are with a business’s goods or services. Although the concept of customer satisfaction is broad, CSAT is a precise measurement.
How to calculate:
Customer feedback is used to measure it, and the result is a percentage (100% would be great, 0% would be awful).
Email Marketing Ecommerce Metrics to Track
Email Open Rate
The percentage of people who receive and open marketing emails from your business is known as your email open rate. The frequency of your emails or the day, time of day, or season you send them may have an impact on the email open rate.
How to estimate:
This parameter can be monitored by your email marketing platform. The email open rate is calculated by dividing the total number of marketing emails opened by the number of delivered campaigns and then multiplying by 100.

Ecommerce metrics benchmark:
According to Klaviyo, the average email open rate across all ecommerce segments is 37.93% as of 2025.
Unsubscribe Rate
The percentage of email list members who unsubscribe from regular newsletters or other emails is known as a company’s unsubscribe rate.
How to measure:
Unsubscribe requests divided by the total number of emails delivered to the list is the unsubscribe rate.

Rate benchmark:
The average unsubscribe rate for e-commerce companies is 0.27% according to Omnisend, while unsubscribe rates as high as 1% are acceptable.
Email List Growth Rate
This indicator tracks the growth of your email list. As more people sign up to receive your emails and others unsubscribe, the number fluctuates.
How to calculate:
(New subscribers during period – People who unsubscribed during period) / Total subscribers at the start of period x 100 is the email list growth rate.

Email Conversion Rate
This metric indicates the proportion of email recipients who click and open the message, then proceed with another intended action, such as downloading a brochure or making a purchase.
How to calculate:
Email conversion rate is calculated as follows: total email recipients x 100 / email recipients who click through to the intended step.

Benchmarks:
Klaviyo report states that all ecommerce industries combined have an average email marketing conversion rate of 0.08%, with the top 10% achieving a conversion rate of 0.44%.
Email Click-Through Rate
One of the key indicators of effectiveness in email marketing is the click-through rate. Email marketers utilize this indicator as one of the success criteria when assessing how well an email campaign is engaging subscribers. The percentage of recipients who clicked on at least one link or call-to-action button in the email is determined by the total number of emails sent. A higher click-through rate indicates that your emails’ content and calls to action are successfully engrossing your readers and motivating them to take action.
How to measure:
You simply need to divide the number of link clicks by the number of emails delivered and then multiply the result by 100.

Benchmark:
In 2025, email marketing should strive for a click-through rate of 2% to 5%, though this can vary depending on the target and industry. Measured results over 5% are considered above average.
How Often Should I Track Ecommerce Metrics?
- Daily
Daily tracking enables you to identify problems and possibilities early on. For example, a successful marketing campaign may result in a jump in conversions, whereas technical issues may cause a dramatic decline in site visitors. It is even more crucial to keep an eye on your website every day during seasonal events like Black Friday.
To gain a general understanding of your daily operations, look at indicators such as website traffic, sales conversion rates, cart abandonment rates, and ad spend efficiency.
- Weekly metrics
You can evaluate current marketing efforts’ efficacy and short-term trends in a weekly assessment. For example, a steady rise in CAC may indicate that your ads are losing their effectiveness and that you need to change your approach.
Typical weekly indicators to monitor are:
– Costs of acquiring new customers (CAC)
– Value of average order (AOV)
– Engagement
- Bi-weekly metrics
Zooming out from your weekly measurements, bi-weekly metrics work best for bigger sample sizes because they are less affected by fluctuations that could happen within a week.
AOV, cost per acquisition (CPA), and shopping cart abandonment are a few examples of these biweekly KPIs.
- Monthly
Because of traffic patterns or, more likely, your own marketing practices, monthly metrics need a longer data window. Email open rate, multichannel engagement, reach, add-to-cart abandonment, and other micro-conversions are examples of these monthly KPIs.
- Quarterly
According to these periods, the most strategic metrics are those that are measured every quarter.
These quarterly metrics will be the long-tail activities that show your firm is thriving and expanding, if your weekly and bi-weekly metrics have shown that it is thriving and surviving. These could include subscription rate, customer lifetime value, and email click-through.
Entrust Your Ecommerce Metrics Optimization to Flowium
Reaching revenue targets and precisely measuring your marketing efforts are made easier by keeping an eye on top ecommerce metrics and KPIs. It gives you information on how well your online store is performing and helps you make more successful strategic marketing choices.
Need assistance comprehending or enhancing your ecommerce performance metrics? Contact Flowium right now! We’ll teach you how to measure ecommerce success, help with identifying points for improvement, and set effective marketing strategies in place.